iD EMARSI on ChartSCRIPT OVERVIEW
The EMARSI indicator is an advanced technical analysis tool that maps RSI values directly onto price charts. With adaptive scaling capabilities, it provides a unique visualization of momentum that flows naturally with price action, making it particularly valuable for FOREX and low-priced securities trading.
KEY FEATURES
1 PRICE MAPPED RSI VISUALIZATION
Unlike traditional RSI that displays in a separate window, EMARSI plots the RSI directly on the price chart, creating a flowing line that identifies momentum shifts within the context of price action:
// Map RSI to price chart with better scaling
mappedRsi = useAdaptiveScaling ?
median + ((rsi - 50) / 50 * (pQH - pQL) / 2 * math.min(1.0, 1/scalingFactor)) :
down == pQL ? pQH : up == pQL ? pQL : median - (median / (1 + up / down))
2 ADAPTIVE SCALING SYSTEM
The script features an intelligent scaling system that automatically adjusts to different market conditions and price levels:
// Calculate adaptive scaling factor based on selected method
scalingFactor = if scalingMethod == "ATR-Based"
math.min(maxScalingFactor, math.max(1.0, minTickSize / (atrValue/avgPrice)))
else if scalingMethod == "Price-Based"
math.min(maxScalingFactor, math.max(1.0, math.sqrt(100 / math.max(avgPrice, 0.01))))
else // Volume-Based
math.min(maxScalingFactor, math.max(1.0, math.sqrt(1000000 / math.max(volume, 100))))
3 MODIFIED RSI CALCULATION
EMARSI uses a specially formulated RSI calculation that works with an adaptive base value to maintain consistency across different price ranges:
// Adaptive RSI Base based on price levels to improve flow
adaptiveRsiBase = useAdaptiveScaling ? rsiBase * scalingFactor : rsiBase
// Calculate RSI components with adaptivity
up = ta.rma(math.max(ta.change(rsiSourceInput), adaptiveRsiBase), emaSlowLength)
down = ta.rma(-math.min(ta.change(rsiSourceInput), adaptiveRsiBase), rsiLengthInput)
// Improved RSI calculation with value constraint
rsi = down == 0 ? 100 : up == 0 ? 0 : 100 - (100 / (1 + up / down))
4 MOVING AVERAGE CROSSOVER SYSTEM
The indicator creates a smooth moving average of the RSI line, enabling a crossover system that generates trading signals:
// Calculate MA of mapped RSI
rsiMA = ma(mappedRsi, emaSlowLength, maTypeInput)
// Strategy entries
if ta.crossover(mappedRsi, rsiMA)
strategy.entry("RSI Long", strategy.long)
if ta.crossunder(mappedRsi, rsiMA)
strategy.entry("RSI Short", strategy.short)
5 VISUAL REFERENCE FRAMEWORK
The script includes visual guides that help interpret the RSI movement within the context of recent price action:
// Calculate pivot high and low
pQH = ta.highest(high, hlLen)
pQL = ta.lowest(low, hlLen)
median = (pQH + pQL) / 2
// Plotting
plot(pQH, "Pivot High", color=color.rgb(82, 228, 102, 90))
plot(pQL, "Pivot Low", color=color.rgb(231, 65, 65, 90))
med = plot(median, style=plot.style_steplinebr, linewidth=1, color=color.rgb(238, 101, 59, 90))
6 DYNAMIC COLOR SYSTEM
The indicator uses color fills to clearly visualize the relationship between the RSI and its moving average:
// Color fills based on RSI vs MA
colUp = mappedRsi > rsiMA ? input.color(color.rgb(128, 255, 0), '', group= 'RSI > EMA', inline= 'up') :
input.color(color.rgb(240, 9, 9, 95), '', group= 'RSI < EMA', inline= 'dn')
colDn = mappedRsi > rsiMA ? input.color(color.rgb(0, 230, 35, 95), '', group= 'RSI > EMA', inline= 'up') :
input.color(color.rgb(255, 47, 0), '', group= 'RSI < EMA', inline= 'dn')
fill(rsiPlot, emarsi, mappedRsi > rsiMA ? pQH : rsiMA, mappedRsi > rsiMA ? rsiMA : pQL, colUp, colDn)
7 REAL TIME PARAMETER MONITORING
A transparent information panel provides real-time feedback on the adaptive parameters being applied:
// Information display
var table infoPanel = table.new(position.top_right, 2, 3, bgcolor=color.rgb(0, 0, 0, 80))
if barstate.islast
table.cell(infoPanel, 0, 0, "Current Scaling Factor", text_color=color.white)
table.cell(infoPanel, 1, 0, str.tostring(scalingFactor, "#.###"), text_color=color.white)
table.cell(infoPanel, 0, 1, "Adaptive RSI Base", text_color=color.white)
table.cell(infoPanel, 1, 1, str.tostring(adaptiveRsiBase, "#.####"), text_color=color.white)
BENEFITS FOR TRADERS
INTUITIVE MOMENTUM VISUALIZATION
By mapping RSI directly onto the price chart, traders can immediately see the relationship between momentum and price without switching between different indicator windows.
ADAPTIVE TO ANY MARKET CONDITION
The three scaling methods (ATR-Based, Price-Based, and Volume-Based) ensure the indicator performs consistently across different market conditions, volatility regimes, and price levels.
PREVENTS EXTREME VALUES
The adaptive scaling system prevents the RSI from generating extreme values that exceed chart boundaries when trading low-priced securities or during high volatility periods.
CLEAR TRADING SIGNALS
The RSI and moving average crossover system provides clear entry signals that are visually reinforced through color changes, making it easy to identify potential trading opportunities.
SUITABLE FOR MULTIPLE TIMEFRAMES
The indicator works effectively across multiple timeframes, from intraday to daily charts, making it versatile for different trading styles and strategies.
TRANSPARENT PARAMETER ADJUSTMENT
The information panel provides real-time feedback on how the adaptive system is adjusting to current market conditions, helping traders understand why the indicator is behaving as it is.
CUSTOMIZABLE VISUALIZATION
Multiple visualization options including Bollinger Bands, different moving average types, and customizable colors allow traders to adapt the indicator to their personal preferences.
CONCLUSION
The EMARSI indicator represents a significant advancement in RSI visualization by directly mapping momentum onto price charts with adaptive scaling. This approach makes momentum shifts more intuitive to identify and helps prevent the scaling issues that commonly affect RSI-based indicators when applied to low-priced securities or volatile markets.
Search in scripts for "the script"

Strategy SuperTrend SDI WebhookThis Pine Script™ strategy is designed for automated trading in TradingView. It combines the SuperTrend indicator and Smoothed Directional Indicator (SDI) to generate buy and sell signals, with additional risk management features like stop loss, take profit, and trailing stop. The script also includes settings for leverage trading, equity-based position sizing, and webhook integration.
Key Features
1. Date-based Trade Execution
The strategy is active only between the start and end dates set by the user.
times ensures that trades occur only within this predefined time range.
2. Position Sizing and Leverage
Uses leverage trading to adjust position size dynamically based on initial equity.
The user can set leverage (leverage) and percentage of equity (usdprcnt).
The position size is calculated dynamically (initial_capital) based on account performance.
3. Take Profit, Stop Loss, and Trailing Stop
Take Profit (tp): Defines the target profit percentage.
Stop Loss (sl): Defines the maximum allowable loss per trade.
Trailing Stop (tr): Adjusts dynamically based on trade performance to lock in profits.
4. SuperTrend Indicator
SuperTrend (ta.supertrend) is used to determine the market trend.
If the price is above the SuperTrend line, it indicates an uptrend (bullish).
If the price is below the SuperTrend line, it signals a downtrend (bearish).
Plots visual indicators (green/red lines and circles) to show trend changes.
5. Smoothed Directional Indicator (SDI)
SDI helps to identify trend strength and momentum.
It calculates +DI (bullish strength) and -DI (bearish strength).
If +DI is higher than -DI, the market is considered bullish.
If -DI is higher than +DI, the market is considered bearish.
The background color changes based on the SDI signal.
6. Buy & Sell Conditions
Long Entry (Buy) Conditions:
SDI confirms an uptrend (+DI > -DI).
SuperTrend confirms an uptrend (price crosses above the SuperTrend line).
Short Entry (Sell) Conditions:
SDI confirms a downtrend (+DI < -DI).
SuperTrend confirms a downtrend (price crosses below the SuperTrend line).
Optionally, trades can be filtered using crossovers (occrs option).
7. Trade Execution and Exits
Market entries:
Long (strategy.entry("Long")) when conditions match.
Short (strategy.entry("Short")) when bearish conditions are met.
Trade exits:
Uses predefined take profit, stop loss, and trailing stop levels.
Positions are closed if the strategy is out of the valid time range.
Usage
Automated Trading Strategy:
Can be integrated with webhooks for automated execution on supported trading platforms.
Trend-Following Strategy:
Uses SuperTrend & SDI to identify trend direction and strength.
Risk-Managed Leverage Trading:
Supports position sizing, stop losses, and trailing stops.
Backtesting & Optimization:
Can be used for historical performance analysis before deploying live.
Conclusion
This strategy is suitable for traders who want to automate their trading using SuperTrend and SDI indicators. It incorporates risk management tools like stop loss, take profit, and trailing stop, making it adaptable for leverage trading. Traders can customize settings, conduct backtests, and integrate it with webhooks for real-time trade execution. 🚀
Important Note:
This script is provided for educational and template purposes and does not constitute financial advice. Traders and investors should conduct their research and analysis before making any trading decisions.

IronBot v4IronBot v4 – Trading Strategy Overview
1. Quick Context
IronBot v4 is a trading strategy designed for users who want a simple yet effective approach to reading the markets. It uses a combination of Fibonacci retracement levels, custom logic triggers, and innovative modules (EMA validation, Iron Impulse Shield and Iron Auto Volume Detector) to identify potential entry and exit points, strengthening the strategy’s detection of sudden market volatility or shifts in trading volume.
2. Theoretical Details
Fibonacci Analysis
The script identifies recent market highs and lows, then calculates key Fibonacci levels (high- and low-based). These levels can help confirm potential reversals or trends.
EMA Option
When enabled, the exponential moving average (EMA) offers additional validation for trade entries. If the current price remains above a certain EMA threshold, long positions may be favored; conversely, if it stays below the EMA, short positions may be initiated.
IIS (Iron Impulse Shield)
IIS helps to filter out risky trades by measuring recent price shocks or surges. If an extreme movement is detected, the strategy may temporarily disable longs or shorts to avoid false signals.
IAVD (Iron Auto Volume Detector)
This functionality automatically detects the average market volume over a defined period (regardless of the market, since it relies on real data). When entering a position, it ensures that overall volume is high enough to confirm a genuinely active, robust market. By providing an additional filter, it can strengthen the decision-making process whenever the market’s participation level is in question.
Panel
IronBot v4 displays a real-time backtest panel that summarizes the selected configuration (including the current pair, analysis window, enabled filters), as well as showing net profit, applicable exchange fees, country taxes, and the final net balance. This gives traders an immediate overview of strategy performance and risk metrics.
What Pinescript Adds Visually
The script plots:
Fibonacci levels (highlighting potential reversal zones)
Trend lines indicating bullish (green) or bearish (red) lean
Optional EMA line
Optional Fibonacci forecast lines for anticipating future moves
Automatic labeling of entry, take-profit, and stop-loss levels, indicating the profit percentage of each trade.
3. Explanation of Inputs
The strategy exposes multiple inputs that can be toggled or configured by the user:
Analysis Window : Dictates how many bars to consider for high/low calculations and the fib retracement thresholds.
TRADES
Display TP/SL: For displaying Take profits and Stop loss.
Display Forecast: When enabled, this feature calculates and projects possible future Fibonacci retracements using historical data, helping traders anticipate potential upcoming trade setups.
Leverage: Only used for the Panel and not for trades. Lets you amplify your position size; higher leverage increases potential gains but also heightens risk. TradingView strategy is using properties for doing this.
Exchange Maker Fees & Exchange Taker Fees: Only used for the Panel and not for trades. Define the percentage cost applied by your exchange for maker and taker trades, respectively. These fees are accounted for in final profit calculations of the Panel.
Country Tax: Only used for the Panel and not for trades. Specifies a tax percentage to be deducted from net profits.
STOP LOSS and TAKE PROFITS
Stop-Loss & Take-Profit Parameters: Controls the percentage distances at which the strategy will exit positions. Additionally, you can configure up to four distinct take-profit levels (TP1 through TP4). Each level should be higher target than the previous one, and you can assign a specific percentage of the total position to close at each TP, ensuring the sum equals 100%. A break-even feature is also available when multiple TPs are used.
EMA
EMA (Exponential Moving Average) Option: When enabled, the strategy opens long trades only if the current price is above the specified EMA length, and opens short trades only if it is below that threshold.
PANELS
Show Panel: For displaying the backtest integrated panel.
IRON IMPULSE SHIELD (IIS)
IIS (Iron Impulse Shield) Option: When enabled, IIS continuously monitors recent price volatility depending on the analysis window set. If the market experiences an extreme surge or drop beyond a specified threshold, IIS temporarily blocks new long or short positions.
IRON AUTO VOLUME DETECTOR (IAVD)
IAVD (Iron Auto Volume Detector) Option: When enabled, it continuously measures the average market volume over a special period, irrespective of the specific trading pair. This ensures that IronBot v4 focuses on markets with robust participation, reducing the likelihood of entering trades during low-liquidity conditions.
By changing these values, IronBot v4 reacts differently to market structure and risk management requirements. Stop-loss and take-profit levels will adjust accordingly, while advanced filters (like EMA or IIS) influence when trades can open.
4. TradingView Strategy Properties
IronBot v4 uses the built-in TradingView “strategy” functionality. In particular:
Order Placement: The code calls strategy.entry() and strategy.close() for direct orders, ensuring signals are sent immediately (no limit orders are used). This helps connect with exchange signal bots for automated execution.
Initial Capital: The code uses initial capital defined in properties for calculating Net balance in the integrated panel.
On bar close: This strategy fill orders on bar close.
Pyramiding: This strategy can take only 1 successive trade in the same direction
Be careful to configure your leverage input depending on your strategy properties.
5. Visualization
5. Purpose & Disclaimer
This script is for educational purposes only and does not constitute financial advice. Past performance does not guarantee future results. Always confirm your own risk tolerance and consult a financial professional before placing live trades. Trading leveraged products can involve substantial risk of loss.

Flux Charts - PAT Automation💎 GENERAL OVERVIEW
The PAT Automation is a powerful and versatile tool designed to help traders rigorously test their trading strategies against historical market data. With an array of advanced settings, traders can fine-tune their strategies, assess performance, and identify key improvements before deploying in live trading environments. This backtester offers a wide range of configurable settings, explained within this write-up.
Features of the PAT Automation:
Step By Step : Configure your strategy step by step, which will allow you to have OR & AND logic in your strategies.
Highly Configurable : Offers multiple parameters for fine-tuning trade entry and exit conditions.
Multi-Timeframe Analysis : Allows traders to analyze multiple timeframes simultaneously for enhanced accuracy.
Provides advanced stop-loss, take-profit, and break-even settings.
Incorporates volume-based conditions, liquidity grabs , order blocks , market structures and fair value gaps for refined strategy execution.
🚩 UNIQUENESS
The PAT Automation stands out from conventional backtesting tools due to its unparalleled flexibility, precision, and advanced trading logic integration. Key factors that make it unique include:
✅ Comprehensive Strategy Customization – Unlike traditional backtesters that offer basic entry and exit conditions, PAT Automation provides a highly detailed parameter set, allowing traders to fine-tune their strategies with precision.
✅ Multi-Timeframe Price Action Features – This is the first-ever tool that allows traders to backtest price action with multi-timeframe features such as Fair Value Gaps (FVGs), Inversion Fair Value Gaps (IFVGs), Order Blocks & Breaker Blocks.
✅ Customizable Take-Profit Conditions – Offers various methods to set take-profit exits, including using core features from price action, and fixed exits like ATR, % change or price change, enabling traders to tailor their exit strategies to specific market behaviors.
✅ Customizable Stop-Loss Conditions – Provides several ways to set up stop losses, including using concepts from price action and trailing stops or fixed exits like ATR, % change or price change, allowing for dynamic risk management tailored to individual strategies.
✅ Integration of External Indicators – Allows the inclusion of other indicators or data sources from TradingView for creating strategy conditions, enabling traders to enhance their strategies with additional insights and data points.
By integrating these advanced features, PAT Automation ensures that traders can rigorously test and optimize their strategies with great accuracy and efficiency.
📌 HOW DOES IT WORK?
The first setting you will want to set it the pyramiding setting. This setting controls the number of simultaneous trades in the same direction allowed in the strategy. For example, if you set it to 1, only one trade can be active in any time, and the second trade will not be entered unless the first one is exited. If it is set to 2, the script will handle both of them at the same time. Note that you should enter the same value to this pyramiding setting, and the pyramiding setting in the "Properties" tab of the script for this to work.
For deep backtesting, you can set "Max Distance To Last Bar" to "Unlimited". If you encounter any memory issues, try decreasing this setting to a lower value.
You can enable and set a backtesting window that will limit the entries to between the start date & end date.
Then, you can enter your desired settings to Price Action features like FVGs, IFVGs, Order Blocks, Breaker Blocks, Liquidity Grabs, Market Structures, EQH & EQL and Volume Imbalances. You can also enable and set up to 3 timeframes, which you can use later on when customizing your strategies enter / exit conditions.
Entry Conditions
From the "Long Conditions" or the "Short Conditions" groups, you can set your position entry conditions. For settings like "initial capital" or "order size", you can open the "Properties" tab, where these are handled.
The PAT Automation can use the following conditions for entry conditions :
1. Order Block (OB)
Detection: Triggered when an Order Block forms or is detected
Retest: Triggered when price retests an Order Block. A retest is confirmed when a candle enters an Order Block and closes outside of it.
Retracement: Triggered when price touches an Order Block
Break: Triggered when an Order Block is invalidated by candle close or wick, depending on the user's input.
2. Breaker Block (BB)
Detection: Triggered when a Breaker Block forms or is detected
Retest: Triggered when price retests a Breaker Block. A retest is confirmed when a candle enters a Breaker Block and closes outside of it.
Retracement: Triggered when price touches a Breaker Block
Break: Triggered when a Breaker Block is invalidated by candle close or wick, depending on the user's input.
3. Fair Value Gap (FVG)
Detection: Triggered when an FVG forms or is detected
Retest: Triggered when price retests an FVG. A retest is confirmed when a candle enters an FVG and closes outside of it.
Retracement: Triggered when price touches an FVG
Break: Triggered when an FVG is invalidated by candle close or wick, depending on the user's input.
4. Inversion Fair Value Gap (IFVG)
Detection: Triggered when an IFVG forms or is detected
Retest: Triggered when price retests an IFVG. A retest is confirmed when a candle enters an IFVG and closes outside of it.
Retracement: Triggered when price touches an IFVG
Break: Triggered when an IFVG is invalidated by candle close or wick, depending on the user's input.
5. Break of Structure (BOS)
Detection: Triggered when a BOS forms or is detected
6. Change of Character (CHoCH)
Detection: Triggered when a CHoCH forms or is detected
7. Change of Character Plus (CHoCH+)
Detection: Triggered when a CHoCH+ forms or is detected
8. Volume Imbalance (VI)
Detection: Triggered when a Volume Imbalance forms or is detected
9. Equal High (EQH)
Detection: Triggered when an EQH is detected
10. Equal Low (EQL)
Detection: Triggered when an EQL is detected
11. Buyside Liquidity Grab
Detection: Triggered when a liquidity grab occurs at Buyside Liquidity (BSL).
12. Sellside Liquidity Grab
Detection: Triggered when a liquidity grab occurs at Sellside Liquidity (SSL).
🕒 TIMEFRAME CONDITIONS
The PAT Automation supports Multi-Timeframe (MTF) features, just like the Price Action Toolkit. When setting an entry condition, you can also choose the timeframe.
To set up MTF conditions, navigate to the 'Timeframes' section in the settings, select your desired timeframes, and enable them. You can choose up to three timeframes.
Once you've selected your timeframes, you can use them in your strategy. When setting long and short entry / exit conditions, you can choose from Timeframe 1, Timeframe 2, or Timeframe 3.
External Conditions
Users can use external indicators on the chart to set entry conditions.
The second dropdown in the external condition settings allows you to choose a conditional operator to compare external outputs. Available options include:
Less Than or Equal To: <=
Less Than: <
Equal To: =
Greater Than: >
Greater Than or Equal To: >=
The position entry conditions work like this ;
Each side has 5 Price Action conditions and 1 Source condition. Each condition can be enabled or disabled using the checkbox on the left side.
For Price Action Conditions, you can set a direction: "Any", "Bullish" or "Bearish".
Then a Price Action Feature, like "FVG" or "Order Block".
The last part of our constructed condition is the alert type, which you can select between "Detection", "Retest", "Retracement" or "Break".
Now you should have a constructed condition, which should look like "Bullish Order Block Retest".
You can select which timeframe should this condition work on from Timeframe 1, 2 or 3. If you select "Any Timeframe", the condition will work for all timeframes.
Lastly select the step of this condition from 1 to 6.
The Source Condition
The last condition on each side is a source condition that is different from the others. Using this condition, you can create your own logic using other indicators' outputs on your chart. For example, suppose that you have an EMA indicator in your chart. You can have the source condition to something like "EMA > high".
The Step System
Each condition has a step number, and conditions are in topological order based on them.
The conditions are executed step by step. This means the condition with step 2 cannot be executed before the condition with step 1 is executed.
Conditions with the same step numbers have "OR" logic. This means that if you have 2 conditions with step 3, the condition with step 4 can trigger after only one of the step 3 conditions is executed.
➕ OTHER ENTRY FEATURES
The PAT Automation allows traders to choose when to execute trades and when not to execute trades.
1. Only Take Trades
This setting lets users specify the time period when their strategy can open or execute trades.
2. Don't Take Trades
This setting lets users specify time periods when their strategy can't open or execute trades.
↩️ EXIT CONDITIONS
1. Exit on Opposite Signal
When enabled, a long position will close when short entry conditions are met, and a short position will close when long entry conditions are met.
2. Exit on Session End
When enabled, positions will be closed at the end of the trading session.
📈 TAKE PROFIT CONDITIONS
There are several methods available for setting take profit exits and conditions.
1. Entry Condition TP
Users can use entry conditions as triggers for take-profit exits. This setting can be found under the long and short exit conditions.
2. Fixed TP
Users can set a fixed TP for exits. This setting can be found under the long and short exit conditions. Users can choose between the following:
Price: This method triggers a TP exit when price reaches a specified level. For example, if you set the Price TP to 10 and buy NASDAQ:TSLA at $190, the trade will automatically exit when the price reaches $200 ($190 + $10).
Ticks: This method triggers a TP exit when price moves a specified number of ticks.
Percentage (%): This method triggers a TP exit when price moves a specified percentage.
ATR: This method triggers a TP exit based on a specified multiple of the Average True Range (ATR).
📉 STOP LOSS CONDITIONS
There are several methods available for setting stop-loss exits and conditions.
1. Entry Condition SL
Users can use entry conditions as triggers for stop-loss exits. This setting can be found under the long and short exit conditions.
2. Fixed SL
Users can set a fixed SL for exits. This setting can be found under the long and short exit conditions. Users can choose between the following:
Price: This method triggers a SL exit when price reaches a specified level. For example, if you set the Price SL to 10 and buy NASDAQ:TSLA at $200, the trade will automatically exit when the price reaches $190 ($200 - $10).
Ticks: This method triggers a SL exit when price moves a specified number of ticks.
Percentage (%): This method triggers a SL exit when price moves a specified percentage.
ATR: This method triggers a SL exit based on a specified multiple of the Average True Range (ATR).
3. Trailing Stop
An explanation & example for the trailing stop feature is present on the write-up within the next section.
Exit conditions have the same logic of constructing conditions like the entry ones. You can construct a Take-Profit Condition & a Stop-Loss Condition. Note that the Take-Profit condition will only work if the position is in profit, regardless of if it's triggered or not. The same applies for the Stop-Loss condition, meaning that it will only work if the position is in loss.
You can also set a Fixed TP & Fixed SL based on the price movement after the position is entered. You have options like "Price", "Ticks", "%", or "Average True Range". For example, you can set a Fixed TP like "5%", and the position will be entered once it moves 5% up in a long position.
Trailing Stop
For the Fixed SL, you also have a "Trailing" stop option, which you can set it's activation level as well. The Trailing stop activation level and it's value are expressed in ticks. Check this scenerio for an example :
We have a ticker with a tick value of $1. Our Trailing Stop is set to 10 ticks and activation level is set to 30 ticks.
We buy 1 contract when the price is $100.
When the price becomes $110, we are in $10 (10 ticks) profit and the trailing stop is now activated.
The current price our stop's on is $110 - $30 (30 ticks), which is the level of $80.
The trailing stop will only move if the price moves up the highest high the price has been after we entered the position.
Let's suppose that price moves up $40 right after our trailing stop is activated. The price will now be $150, and our trailing stop will sit on $150 - $30 (30 ticks) = $120.
If the price is down the $120 level, our stop loss will be triggered.
There is also a "Hard SL" option designed for a backup stop-loss when trailing stops are enabled. You can enable & set this option and if the price goes down before our trailing stop even activates, the position will be exited.
You can also move stop-loss to the break-even (entry price of the position) after a certain profit is achieved using the last setting of the exit conditions. Note that for this to work, you will need to have a Fixed SL set-up.
➕ OTHER EXIT FEATURES
1. Move Stop Loss to Breakeven
This setting allows the strategy to automatically move the SL to Breakeven (BE) when the position is in profit by a certain amount. Users can choose between the following:
Price: This method moves the SL to BE when price reaches a specified level.
Ticks: This method moves the SL to BE when price moves a specified number of ticks.
Percentage (%): This method moves the SL to BE when price moves a specified percentage.
ATR: This method moves the SL to BE when price moves a specified multiple of the Average True Range (ATR).
Example Entry Scenario
To give an example , check this scenario; out conditions are :
LONG CONDITIONS
Bullish Order Block Detection, Step 1
Bullish CHoCH Detection, Step 2
Bullish Volume Imbalance Detection, Step 2
Bullish IFVG Retest, Step 3
First, the strategy needs to detect a Bullish Order Block in order to start working.
After it's detected, now it's looking for either a CHoCH, or a Volume Imbalance to proceed to the next step, the reason for this is that they both have the same step number.
After one of them is detected, the strategy will consistently check all IFVGs for a retest. If the retest occurs, a long position will be entered.
⏰ ALERTS
This indicator uses TradingView's strategy alert system. All entries and exits will be sent as an alert if configured. It's possible to further customize these alerts to your liking. For more information check TradingView's strategy alert customization page: www.tradingview.com
⚙️ SETTINGS
1. Backtesting Settings
Pyramiding: Controls the number of simultaneous trades allowed in the strategy. This setting must have the same value that is entered on the script's properties tab on the settings pane.
Max Distance to Last Bar: Determines the depth of historical data used to prevent memory overload.
Enable Custom Backtesting Period: Restricts backtesting to a specific date range.
Start & End Time Configuration: Define precise start and end dates for historical analysis.
2. Fair Value Gaps Settings
Zone Invalidation: Select between "Wick" and "Close" invalidation.
Filtering: Choose between "Average Range" and "Volume Threshold".
FVG Sensitivity: Ranges from Extreme to Low to detect FVGs with varying strictness.
Allow Gaps: Enables analysis on tickers that have different open-close price gaps.
3. Inversion Fair Value Gaps Settings
Zone Invalidation: Choose between "Wick" and "Close".
4. Order Block Settings
Swing Length: Adjusts the minimum number of bars required for OB formation.
Zone Invalidation Method: Select between "Wick" and "Close".
5. Breaker Block Settings
Zone Invalidation: Set invalidation method as "Wick" or "Close".
6. Liquidity Grabs Settings
Pivot Length: Adjusts the number of bars used to detect liquidity grabs.
Wick-Body Ratio: Defines the proportion of wick-to-body size for liquidity grab detection.
7. Multi-Timeframe Analysis
Enable Up to Three Timeframes: Select and analyze trades across multiple timeframes.
8. Market Structures
Swing Length: Defines the number of bars required for structure shifts.
Includes BOS, CHoCH, CHoCH+ Detection.
9. Equal Highs & Lows
ATR Multiplier: Defines the sensitivity of equal highs/lows detection.
10. Volume Imbalances
Gap Size Sensitivity: Ranges from "Ultra" to "Low".
Disable Overnight Gaps: Filters out volume imbalances occurring due to overnight gaps.
11. Entry Conditions for Long & Short Trades
Multiple Conditions (1-6): Configure up to six independent conditions per trade direction.
Condition Types: Options include Detection, Retest, Retracement, and Break.
Timeframe Specification: Choose between "Any Timeframe", "Timeframe 1", "Timeframe 2", or "Timeframe 3".
Trade Execution Filters: Restrict trades within specific trading sessions.
12. Exit Conditions for Long & Short Trades
Exit on Opposite Signal: Automatically exit trades upon opposite trade conditions.
Exit on Session End: Closes all positions at the end of the trading session.
Multiple Take-Profit (TP) and Stop-Loss (SL) Configurations:
TP/SL based on % move, ATR, Ticks, or Fixed Price.
Hard SL option for additional risk control.
Move SL to BE (Break Even) after a certain profit threshold.

Flux Charts - SFX Automation💎 GENERAL OVERVIEW
The SFX Automation is a powerful and versatile tool designed to help traders rigorously test their trading strategies against historical market data. With various advanced settings, traders can fine-tune their strategies, assess performance, and identify key improvements before deploying in live trading environments. This tool offers a wide range of configurable settings, explained within this write-up.
Features of the new SFX Automation :
Step By Step : Configure your strategy step by step, which will allow you to have OR & AND logic in your strategies.
Highly Configurable : Offers multiple parameters for fine-tuning trade entry and exit conditions.
Multi-Timeframe Analysis : Allows traders to analyze multiple timeframes simultaneously for enhanced accuracy.
Provides advanced stop-loss, take-profit, and break-even settings.
Incorporates Buy & Sell signals, with settings like Signal Sensitivity, Strength, Time Weighting, Dynamic TP & SL Methods and more for refined strategy execution.
🚩 UNIQUENESS
The SFX Automation stands out from conventional backtesting tools due to its unparalleled flexibility, precision, and advanced trading logic integration. Key factors that make it unique include:
✅ Comprehensive Strategy Customization – Unlike traditional backtesters that offer basic entry and exit conditions, SFX Automation provides a highly detailed parameter set, allowing traders to fine-tune their strategies with precision.
✅ Multi-Timeframe Signals – This is the first-ever tool that allows traders to backtest Buy & Sell Signals on multiple timeframes.
✅ Customizable Take-Profit Conditions – Offers various methods to set take-profit exits, including using core features from SFX Algo, and dynamic exits like signal rating upgrades/downgrades, enabling traders to tailor their exit strategies to specific market behaviors.
✅ Customizable Stop-Loss Conditions – Provides several ways to set up stop losses, including using concepts from SFX Algo and trailing stops or dynamic exits like signal rating upgrades/downgrades, allowing for dynamic risk management tailored to individual strategies.
✅ Integration of External Indicators – Allows the inclusion of other indicators or data sources from TradingView for creating strategy conditions, enabling traders to enhance their strategies with additional insights and data points.
By integrating these advanced features, SFX Automation ensures that traders can rigorously test and optimize their strategies with great accuracy and efficiency.
📌 HOW DOES IT WORK ?
The first setting you will want to set it the pyramiding setting. This setting controls the number of simultaneous trades in the same direction allowed in the strategy. For example, if you set it to 1, only one trade can be active in any time, and the second trade will not be entered unless the first one is exited. If it is set to 2, the script will handle both of them at the same time. Note that you should enter the same value to this pyramiding setting, and the pyramiding setting in the "Properties" tab of the script for this to work.
You can enable and set a backtesting window that will limit the entries to between the start date & end date.
Entry Conditions
From the "Long Conditions" or the "Short Conditions" groups, you can set your position entry conditions. For settings like "initial capital" or "order size", you can open the "Properties" tab, where these are handled.
The SFX Algo can use the following conditions for entry conditions :
1. Buy Signal (Any, or 1-5 ☆)
This condition is triggered when a Buy Signal occurs. Other timeframes are supported with this condition.
2. Buy | TP (1, 2 or 3)
This condition is triggered when a TP signal of any Buy signal occurs.
3. Buy | SL
This condition is triggered when a SL signal of any Buy signal occurs.
4. Buy | Rating Upgrade
This condition is triggered when the rating of a buy signal is increased.
5. Buy | Rating Downgrade
This condition is triggered when the rating of a buy signal is decreased.
6. Sell Signal (Any, or 1-5 ☆)
This condition is triggered when a Sell Signal occurs. Other timeframes are supported with this condition.
7. Sell | TP (1, 2 or 3)
This condition is triggered when a TP signal of any Sell signal occurs.
8. Sell | SL
This condition is triggered when a SL signal of any Sell signal occurs.
9. Sell | Rating Upgrade
This condition is triggered when the rating of a sell signal is increased.
10. Sell | Rating Downgrade
This condition is triggered when the rating of a sell signal is decreased.
11. Retracement Wave Retest (Bullish or Bearish)
A retest on the Retracement Wave occurs when the price temporarily moves against the prevailing trend, touching or entering the wave before continuing in the original trend direction. This retest serves as a confirmation that the wave is acting as dynamic support or resistance.
12. Retracement Wave Retracement (Bullish or Bearish)
A retracement on the Retracement Wave occurs when the price touches the wave, the condition is triggered immediately.
13. Volatility Bands Retest (Bullish or Bearish)
A retest of Volatility Bands occurs when the price initially moves beyond the bands, then pulls back to "retest" the band it just broke through before continuing its move. This can provide traders with confirmation of a breakout or signal a potential reversal.
14. Volatility Bands Retracement (Bullish or Bearish)
A retracement on the Volatility Bands occur when the price touches the band, the condition is triggered immediately.
🕒 TIMEFRAME CONDITIONS
The SFX Automation supports Multi-Timeframe (MTF) features for Buy & Sell signals. When setting an entry condition, you can also choose the timeframe.
External Conditions
Users can use external indicators on the chart to set entry conditions.
The second dropdown in the external condition settings allows you to choose a conditional operator to compare external outputs. Available options include:
Less Than or Equal To: <=
Less Than: <
Equal To: =
Greater Than: >
Greater Than or Equal To: >=
The position entry conditions work like this ;
Each side has 3 SFX Algo conditions and 2 Source conditions. Each condition can be enabled or disabled using the checkbox on the left side of them.
You can select which timeframe this condition should work on for Buy & Sell signals. If you select "Chart", the condition will work for the chart's current timeframe.
Lastly select the step of this condition from 1 to 6.
The Source Condition
The last condition on each side is a source condition that is different from the others. Using this condition, you can create your own logic using other indicators' outputs on your chart. For example, suppose that you have an EMA indicator in your chart. You can have the source condition to something like "EMA > high".
The Step System
Each condition has a step number, and conditions are in topological order based on them.
The conditions are executed step by step. This means the condition with step 2 cannot be executed before the condition with step 1 is executed.
Conditions with the same step numbers have "OR" logic. This means that if you have 2 conditions with step 3, the condition with step 4 can trigger after only one of the step 3 conditions is executed.
➕ OTHER ENTRY FEATURES
The SFX Automation allows traders to choose when to execute trades and when not to execute trades.
1. Only Take Trades
This setting lets users specify the time period when their strategy can open or execute trades.
2. Don't Take Trades
This setting lets users specify time periods when their strategy can't open or execute trades.
↩️ EXIT CONDITIONS
1. Exit on Opposite Signal
When enabled, a long position will close when short entry conditions are met, and a short position will close when long entry conditions are met.
2. Exit on Session End
When enabled, positions will be closed at the end of the trading session.
📈 TAKE PROFIT CONDITIONS
There are several methods available for setting take profit exits and conditions.
1. Entry Condition TP
Users can use entry conditions as triggers for take profit exits. This setting can be found under the long and short exit conditions.
2. Fixed TP
Users can set a fixed TP for exits. This setting can be found under the long and short exit conditions. Users can choose between the following:
Price: This method triggers a TP exit when price reaches a specified level. For example, if you set the Price TP to 10 and buy NASDAQ:TSLA at $190, the trade will automatically exit when the price reaches $200 ($190 + $10).
Ticks: This method triggers a TP exit when price moves a specified number of ticks.
Percentage (%): This method triggers a TP exit when price moves a specified percentage.
ATR: This method triggers a TP exit based on a specified multiple of the Average True Range (ATR).
🧩EXIT PERCENTAGES
For each 3 dynamic take-profit conditions, you can set the amount of the position to exit in terms of percentage. It's important to make sure that the total of the exit percentages are 100%.
📉 STOP LOSS CONDITIONS
There are several methods available for setting stop-loss exits and conditions.
1. Entry Condition SL
Users can use entry conditions as triggers for stop-loss exits. This setting can be found under the long and short exit conditions.
2. Fixed SL
Users can set a fixed SL for exits. This setting can be found under the long and short exit conditions. Users can choose between the following:
Price: This method triggers a SL exit when price reaches a specified level. For example, if you set the Price SL to 10 and buy NASDAQ:TSLA at $200, the trade will automatically exit when the price reaches $190 ($200 - $10).
Ticks: This method triggers a SL exit when price moves a specified number of ticks.
Percentage (%): This method triggers a SL exit when price moves a specified percentage.
ATR: This method triggers a SL exit based on a specified multiple of the Average True Range (ATR).
3. Trailing Stop
An explanation & example for the trailing stop feature is present on the write-up within the next section.
Exit conditions have the same logic of constructing conditions like the entry ones. You can construct a Take-Profit Condition & a Stop-Loss Condition. Note that the Take-Profit condition will only work if the position is in profit, regardless of if it's triggered or not. The same applies for the Stop-Loss condition, meaning that it will only work if the position is in loss.
You can also set a Fixed TP & Fixed SL based on the price movement after the position is entered. You have options like "Price", "Ticks", "%", or "Average True Range". For example, you can set a Fixed TP like "5%", and the position will be entered once it moves 5% up in a long position.
Trailing Stop
For the Fixed SL, you also have a "Trailing" stop option, which you can set it's activation level as well. The Trailing stop activation level and it's value are expressed in ticks. Check this scenerio for an example :
We have a ticker with a tick value of $1. Our Trailing Stop is set to 10 ticks, and the activation level is set to 30 ticks.
We buy 1 contract when the price is $100.
When the price becomes $110, we are in $10 (10 ticks) profit and the trailing stop is now activated.
The current price our stop's on is $110 - $30 (30 ticks), which is the level of $80.
The trailing stop will only move if the price moves up the highest high the price has been after we entered the position.
Let's suppose that price moves up $40 right after our trailing stop is activated. The price will now be $150, and our trailing stop will sit on $150 - $30 (30 ticks) = $120.
If the price is down the $120 level, our stop loss will be triggered.
There is also a "Hard SL" option designed for a backup stop-loss when trailing stops are enabled. You can enable & set this option and if the price goes down before our trailing stop even activates, the position will be exited.
You can also move stop-loss to the break-even (entry price of the position) after a certain profit is achieved using the last setting of the exit conditions. Note that for this to work, you will need to have a Fixed SL setup.
➕ OTHER EXIT FEATURES
1. Move Stop Loss to Breakeven
This setting allows the strategy to automatically move the SL to Breakeven (BE) when the position is in profit by a certain amount. Users can choose between the following:
Price: This method moves the SL to BE when price reaches a specified level.
Ticks: This method moves the SL to BE when price moves a specified number of ticks.
Percentage (%): This method moves the SL to BE when price moves a specified percentage.
ATR: This method moves the SL to BE when price moves a specified multiple of the Average True Range (ATR).
Example Entry Scenario
To give an example , check this scenario; out conditions are :
LONG CONDITIONS
Buy Signal Any☆, Step 1
Bullish R. Wave Retest, Step 2
Bullish V. Bands Retest, Step 2
open > close, Step 3
First, the strategy needs to detect a Buy Signal with any star rating in order to start working.
After it's detected, now it's looking for either a Bullish R. Wave Retest, or a Bullish V. Bands Retest to proceed to the next step, the reason for this is that they both have the same step number.
After one of them is detected, the strategy will consistently check candlesticks for the condition open > close. If a bullish candlestick occurs, a long position will be entered.
⏰ ALERTS
This indicator uses TradingView's strategy alert system. All entries and exits will be sent as an alert if configured. It's possible to further customize these alerts to your liking. For more information, check TradingView's strategy alert customization page: www.tradingview.com
⚙️ SETTINGS
1. Backtesting Settings
Pyramiding: Controls the number of simultaneous trades allowed in the strategy. This setting must have the same value that is entered on the script's properties tab on the settings pane.
Enable Custom Backtesting Period: Restricts backtesting to a specific date range.
Start & End Time Configuration: Define precise start and end dates for historical analysis.
2. Algorithm Settings
Sensitivity: The sensitivity setting is a key parameter that influences the number of signals the SFX Algo generates. By adjusting this parameter, you can control the frequency of signals produced by the algorithm.
Signal Strength: The Signal Strength setting filters signals based on their quality, allowing traders to focus on the most reliable opportunities. This feature helps traders balance the quantity and reliability of the algorithm’s signals to suit their trading strategy.
Time Weighting: The Time Weighting setting determines how the SFX Algo evaluates historical market data to generate signals.
a) Recent Trends
Focuses on the most recent movements for short-term analysis. This setting is good for scalpers and intraday traders who need to react quickly to market changes.
b) Mixed Trends
Balances recent and historical price movements for a comprehensive market view. This setting is well-suited for swing traders and those who want to capture medium-term opportunities by combining the benefits of short-term responsiveness with the reliability of long-term trends.
c) Long-term Trends
Relies on extended historical market data to identify broader market trends, making it an excellent choice for traders focused on long-term strategies.
Minimum Star Rating: The Minimum Star Rating setting allows you to filter signals based on their strength, showing only those that meet or exceed your chosen threshold. For instance, setting the minimum star rating to 3 ensures you only receive signals with a rating of 3 stars or higher.
3. Take Profit / Stop Loss Methods
Key Levels
The Key Levels method uses pivot points to set take profit and stop-loss levels. The TP and SL levels are shown when a new signal is generated.
Volatility Bands
This TP/SL method uses the Volatility Bands overlay to set dynamic TP and SL levels. These levels are not predetermined so they will not be shown in advance when a signal is generated.
Signal Rating
Sets take profit and stop-loss levels based on changes in a signal's rating strength. These levels are not predetermined so they will not be shown in advance when a signal is generated.
Auto Stop-Loss
The auto method can only be applied to the SL. The auto method allows the algorithm to detect SL automatically when a momentum shift is detected. You can adjust the risk tolerance of the Auto SL by adjusting the ‘Auto Risk Tolerance’ setting. You can choose between Low, Medium, and High. A high-risk tolerance will result in stop losses being triggered less often.
4. Entry Conditions for Long & Short Trades
Multiple Conditions (1-6): Configure up to six independent conditions per trade direction.
Timeframe Specification: Choose between timeframes for Buy & Sell signals.
Trade Execution Filters: Restrict trades within specific trading sessions.
5. Exit Conditions for Long & Short Trades
Exit on Opposite Signal: Automatically exit trades upon opposite trade conditions.
Exit on Session End: Closes all positions at the end of the trading session.
Multiple Take-Profit (TP) and Stop-Loss (SL) Configurations:
TP/SL based on % move, ATR, Ticks, or Fixed Price.
Hard SL option for additional risk control.
Move SL to BE (Break Even) after a certain profit threshold.

Ultimate T3 Fibonacci for BTC Scalping. Look at backtest report!Hey Everyone!
I created another script to add to my growing library of strategies and indicators that I use for automated crypto trading! This strategy is for BITCOIN on the 30 minute chart since I designed it to be a scalping strategy. I calculated for trading fees, and use a small amount of capital in the backtest report. But feel free to modify the capital and how much per order to see how it changes the results:)
It is called the "Ultimate T3 Fibonacci Indicator by NHBprod" that computes and displays two T3-based moving averages derived from price data. The t3_function calculates the Tilson T3 indicator by applying a series of exponential moving averages to a combined price metric and then blending these results with specific coefficients derived from an input factor.
The script accepts several user inputs that toggle the use of the T3 filter, select the buy signal method, and set parameters like lengths and volume factors for two variations of the T3 calculation. Two T3 lines, T3 and T32, are computed with different parameters, and their colors change dynamically (green/red for T3 and blue/purple for T32) based on whether the lines are trending upward or downward. Depending on the selected signal method, the script generates buy signals either when T32 crosses over T3 or when the closing price is above T3, and similarly, sell signals are generated on the respective conditions for crossing under or closing below. Finally, the indicator plots the T3 lines on the chart, adds visual buy/sell markers, and sets alert conditions to notify users when the respective trading signals occur.
The user has the ability to tune the parameters using TP/SL, date timerames for analyses, and the actual parameters of the T3 function including the buy/sell signal! Lastly, the user has the option of trading this long, short, or both!
Let me know your thoughts and check out the backtest report!

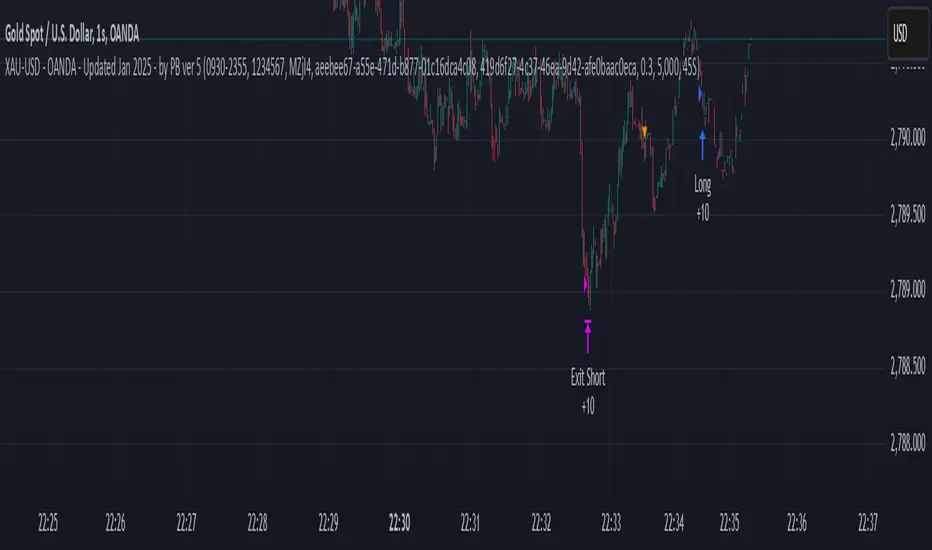
XAU-USD - OANDA - Updated Jan 2025 - by PB ver 5Script Title: XAU-USD - OANDA - Updated Jan 2025 - by PB ver 5
Description:
This strategy is designed for trading XAU/USD (Gold) on the OANDA platform, optimized with a session-based filter and Renko bar indicators for enhanced price action analysis. The script utilizes trailing stop loss functionality to manage risk effectively and allows flexibility for both long and short trades.
Key Features:
Date Filter: This strategy includes a time filter to backtest the performance from January 1st, 2025 to December 31st, 2025. Users can enable or disable the filter based on their preference.
Session Filter: Customizable session inputs allow the user to define the active trading session using a time range (default is 09:20-15:16) and the days of the week (default is all days, 1-7). The strategy will only enter trades during the active session, ensuring more controlled and focused trading.
Renko Bar Strategy: This strategy uses Renko charts, a popular price action tool, to detect buy and sell signals based on the crossover of Renko close and open prices. Users can adjust the Renko block size and the Renko value used for detecting price action shifts.
Trailing Stops: The script applies a trailing stop loss mechanism for both long and short trades. The trailing stop is dynamically updated to follow the market as prices move in favor of the trade. It uses a 5000-point trailing stop (adjustable by the user).
Flexible Trade Settings: Users can enable or disable long and short positions through simple toggle switches. The strategy allows for full control over trade entry and exit.
How It Works:
Long Trades: A long position is entered when the Renko close crosses above the Renko open. The position will be exited using a trailing stop, which follows the price in the market.
Short Trades: A short position is entered when the Renko close crosses below the Renko open. The position will also exit using a trailing stop.
The strategy will automatically close positions if the session ends or if the user manually exits the trades.
Customization Options:
Backtest Date Range: Set the start and end dates to backtest the strategy over a specific time period.
Session and Days: Adjust the session time and which days of the week the strategy is active.
Renko Block Size: Customize the Renko block size for finer control over price action signals.
Trailing Stop Distance: Adjust the trailing stop loss to your preferred risk levels.
Limitations and Considerations:
Renko Charting: Renko charts may not suit every trading style, as they are based on price movement rather than time. This strategy is designed for traders who prefer this style of charting.
Backtest Results: Always review the strategy's backtest results with realistic parameters. The strategy uses historical data, and past performance is not indicative of future results. Be aware of slippage and commission costs in real-world trading scenarios.
Manual Intervention: Users should monitor active trades and intervene manually if required.
Ideal Usage:
This strategy is suited for traders looking to use price action-based strategies with Renko charts for XAU/USD on the OANDA platform.
Ideal for those who want to automate their entry and exit points with trailing stop mechanisms while having control over the session time and backtesting period.
Disclaimer:
Past performance does not guarantee future results. Always use caution when using trading strategies and adjust parameters based on market conditions. The strategy is provided for educational purposes and should be tested on paper before live trading.
Harmony Signal Flow By ArunThis Pine Script strategy, titled "Harmony Signal Flow By Arun," uses the Relative Strength Index (RSI) indicator to generate buy and sell signals based on custom thresholds. The script incorporates stop-loss and target management and restricts new trades until the previous position closes. Here's a detailed description:
Custom RSI Metric:
The strategy calculates a 5-period RSI based on the closing price, aiming for a more responsive measure of price momentum.
RSI thresholds are defined:
Lower threshold (30): Indicates oversold conditions, triggering a potential buy.
Upper threshold (70): Indicates overbought conditions, prompting a possible sell.
Entry Conditions:
Buy Signal: The strategy initiates a buy order when the RSI crosses above the lower threshold (30), indicating a shift from oversold conditions.
Sell Signal: A sell order is triggered when the RSI crosses below the upper threshold (70), suggesting an overbought reversal.
Only one order (buy or sell) can be active at a time, ensuring that a new trade begins only when there’s no existing position.
Stop-Loss and Target Management:
For each trade, stop-loss and target conditions are applied to manage risk and secure profits.
For Buy Positions:
Stop-loss is set 100 points below the entry price.
Target is set 150 points above the entry price.
For Sell Positions:
Stop-loss is set 100 points above the entry price.
Target is 150 points below the entry price.
The strategy closes the trade when either the stop-loss or target is met, marking the trade as "closed" and allowing a new trade entry.
Trade Sequencing:
A new trade (buy or sell) is only permitted after the previous position hits either its stop-loss or target, preventing overlapping trades and ensuring clear trade sequences.
This sequential approach enhances risk management by ensuring only one active position at any time.
End-of-Day Closure:
All open positions are closed automatically at 3:25 PM (Indian market time) to avoid overnight exposure, ensuring the strategy remains strictly intraday.
The flag for trade entry is reset at the end of each day, enabling fresh trades the next day.
Chart Indicators:
The script plots buy and sell signals directly on the chart with visible labels.
It also displays the custom RSI metric with horizontal lines for the lower and upper thresholds, providing visual cues for entry and exit points.
Summary
This strategy is a momentum-based intraday trading approach that uses the RSI for identifying potential reversals and manages trades through predefined stop-loss and target levels. By enforcing trade sequencing and closing positions at the end of the trading day, it prioritizes risk management and seeks to capitalize on short-term trends while avoiding overnight market risks.

Simple RSI stock Strategy [1D] The "Simple RSI Stock Strategy " is designed to long-term traders. Strategy uses a daily time frame to capitalize on signals generated by the Relative Strength Index (RSI) and the Simple Moving Average (SMA). This strategy is suitable for low-leverage trading environments and focuses on identifying potential buy opportunities when the market is oversold, while incorporating strong risk management with both dynamic and static Stop Loss mechanisms.
This strategy is recommended for use with a relatively small amount of capital and is best applied by diversifying across multiple stocks in a strong uptrend, particularly in the S&P 500 stock market. It is specifically designed for equities, and may not perform well in other markets such as commodities, forex, or cryptocurrencies, where different market dynamics and volatility patterns apply.
Indicators Used in the Strategy:
1. RSI (Relative Strength Index):
- The RSI is a momentum oscillator used to identify overbought and oversold conditions in the market.
- This strategy enters long positions when the RSI drops below the oversold level (default: 30), indicating a potential buying opportunity.
- It focuses on oversold conditions but uses a filter (SMA 200) to ensure trades are only made in the context of an overall uptrend.
2. SMA 200 (Simple Moving Average):
- The 200-period SMA serves as a trend filter, ensuring that trades are only executed when the price is above the SMA, signaling a bullish market.
- This filter helps to avoid entering trades in a downtrend, thereby reducing the risk of holding positions in a declining market.
3. ATR (Average True Range):
- The ATR is used to measure market volatility and is instrumental in setting the Stop Loss.
- By multiplying the ATR value by a custom multiplier (default: 1.5), the strategy dynamically adjusts the Stop Loss level based on market volatility, allowing for flexibility in risk management.
How the Strategy Works:
Entry Signals:
The strategy opens long positions when RSI indicates that the market is oversold (below 30), and the price is above the 200-period SMA. This ensures that the strategy buys into potential market bottoms within the context of a long-term uptrend.
Take Profit Levels:
The strategy defines three distinct Take Profit (TP) levels:
TP 1: A 5% from the entry price.
TP 2: A 10% from the entry price.
TP 3: A 15% from the entry price.
As each TP level is reached, the strategy closes portions of the position to secure profits: 33% of the position is closed at TP 1, 66% at TP 2, and 100% at TP 3.
Visualizing Target Points:
The strategy provides visual feedback by plotting plotshapes at each Take Profit level (TP 1, TP 2, TP 3). This allows traders to easily see the target profit levels on the chart, making it easier to monitor and manage positions as they approach key profit-taking areas.
Stop Loss Mechanism:
The strategy uses a dual Stop Loss system to effectively manage risk:
ATR Trailing Stop: This dynamic Stop Loss adjusts based on the ATR value and trails the price as the position moves in the trader’s favor. If a price reversal occurs and the market begins to trend downward, the trailing stop closes the position, locking in gains or minimizing losses.
Basic Stop Loss: Additionally, a fixed Stop Loss is set at 25%, limiting potential losses. This basic Stop Loss serves as a safeguard, automatically closing the position if the price drops 25% from the entry point. This higher Stop Loss is designed specifically for low-leverage trading, allowing more room for market fluctuations without prematurely closing positions.
to determine the level of stop loss and target point I used a piece of code by RafaelZioni, here is the script from which a piece of code was taken
Together, these mechanisms ensure that the strategy dynamically manages risk while offering robust protection against significant losses in case of sharp market downturns.
The position size has been estimated by me at 75% of the total capital. For optimal capital allocation, a recommended value based on the Kelly Criterion, which is calculated to be 59.13% of the total capital per trade, can also be considered.
Enjoy !

ICT Indicator with Paper TradingThe strategy implemented in the provided Pine Script is based on **ICT (Inner Circle Trader)** concepts, particularly focusing on **order blocks** to identify key levels for potential reversals or continuations in the market. Below is a detailed description of the strategy:
### 1. **Order Block Concept**
- **Order blocks** are price levels where large institutional orders accumulate, often leading to a reversal or continuation of price movement.
- In this strategy, **order blocks** are identified when:
- The high of the current bar crosses above the high of the previous bar (for bullish order blocks).
- The low of the current bar crosses below the low of the previous bar (for bearish order blocks).
### 2. **Buy and Sell Signal Generation**
The core of the strategy revolves around identifying the **breakout** of order blocks, which is interpreted as a signal to either enter or exit trades:
- **Buy Signal**:
- Generated when the closing price crosses **above** the last identified bullish order block (i.e., the highest point during the last upward crossover of highs).
- This signals a potential upward trend, and the strategy enters a long position.
- **Sell Signal**:
- Generated when the closing price crosses **below** the last identified bearish order block (i.e., the lowest point during the last downward crossover of lows).
- This signals a potential downward trend, and the strategy exits any open long positions.
### 3. **Strategy Execution**
The strategy is executed using the `strategy.entry()` and `strategy.close()` functions:
- **Enter Long Positions**: When a buy signal is generated, the strategy opens a long position (buying).
- **Exit Positions**: When a sell signal is generated, the strategy closes the long position.
### 4. **Visual Indicators on the Chart**
To make the strategy easier to follow visually, buy and sell signals are marked directly on the chart:
- **Buy signals** are indicated with a green upward-facing triangle above the bar where the signal occurred.
- **Sell signals** are indicated with a red downward-facing triangle below the bar where the signal occurred.
### 5. **Key Elements of the Strategy**
- **Trend Continuation and Reversals**: This strategy is attempting to capture trends based on the breakout of important price levels (order blocks). When the price breaks above or below a significant order block, it is expected that the market will continue in that direction.
- **Order Block Strength**: Order blocks are considered strong areas where price action could reverse or accelerate, based on how institutional investors place large orders.
### 6. **Paper Trading**
This script uses **paper trading** to simulate trades without actual money being involved. This allows users to backtest the strategy, seeing how it would have performed in historical market conditions.
### 7. **Basic Strategy Flow**
1. **Order Block Identification**: The script constantly monitors price movements to detect bullish and bearish order blocks.
2. **Buy Signal**: If the closing price crosses above the last order block high, the strategy interprets it as a sign of bullish momentum and enters a long position.
3. **Sell Signal**: If the closing price crosses below the last order block low, it signals a bearish momentum, and the strategy closes the long position.
4. **Visual Representation**: Buy and sell signals are displayed on the chart for easy identification.
### **Advantages of the Strategy:**
- **Simple and Clear Rules**: The strategy is based on clearly defined rules for identifying order blocks and trade signals.
- **Effective for Trend Following**: By focusing on breakouts of order blocks, this strategy attempts to capture strong trends in the market.
- **Visual Aids**: The plot of buy/sell signals helps traders to quickly see where trades would have been placed.
### **Limitations:**
- **No Shorting**: This strategy only enters long positions (buying). It does not account for shorting opportunities.
- **No Risk Management**: There are no built-in stop losses, trailing stops, or profit targets, which could expose the strategy to large losses during adverse market conditions.
- **Whipsaws in Range Markets**: The strategy could produce false signals in sideways or choppy markets, where breakouts are short-lived and prices quickly reverse.
### **Overall Strategy Objective:**
The goal of the strategy is to enter into long positions when the price breaks above a significant order block, and exit when it breaks below. The strategy is designed for trend-following, with the assumption that price will continue in the direction of the breakout.
Let me know if you'd like to enhance or modify this strategy further!

Intramarket Difference Index StrategyHi Traders !!
The IDI Strategy:
In layman’s terms this strategy compares two indicators across markets and exploits their differences.
note: it is best the two markets are correlated as then we know we are trading a short to long term deviation from both markets' general trend with the assumption both markets will trend again sometime in the future thereby exhausting our trading opportunity.
📍 Import Notes:
This Strategy calculates trade position size independently (i.e. risk per trade is controlled in the user inputs tab), this means that the ‘Order size’ input in the ‘Properties’ tab will have no effect on the strategy. Why ? because this allows us to define custom position size algorithms which we can use to improve our risk management and equity growth over time. Here we have the option to have fixed quantity or fixed percentage of equity ATR (Average True Range) based stops in addition to the turtle trading position size algorithm.
‘Pyramiding’ does not work for this strategy’, similar to the order size input togeling this input will have no effect on the strategy as the strategy explicitly defines the maximum order size to be 1.
This strategy is not perfect, and as of writing of this post I have not traded this algo.
Always take your time to backtests and debug the strategy.
🔷 The IDI Strategy:
By default this strategy pulls data from your current TV chart and then compares it to the base market, be default BINANCE:BTCUSD . The strategy pulls SMA and RSI data from either market (we call this the difference data), standardizes the data (solving the different unit problem across markets) such that it is comparable and then differentiates the data, calling the result of this transformation and difference the Intramarket Difference (ID). The formula for the the ID is
ID = market1_diff_data - market2_diff_data (1)
Where
market(i)_diff_data = diff_data / ATR(j)_market(i)^0.5,
where i = {1, 2} and j = the natural numbers excluding 0
Formula (1) interpretation is the following
When ID > 0: this means the current market outperforms the base market
When ID = 0: Markets are at long run equilibrium
When ID < 0: this means the current market underperforms the base market
To form the strategy we define one of two strategy type’s which are Trend and Mean Revesion respectively.
🔸 Trend Case:
Given the ‘‘Strategy Type’’ is equal to TREND we define a threshold for which if the ID crosses over we go long and if the ID crosses under the negative of the threshold we go short.
The motivating idea is that the ID is an indicator of the two symbols being out of sync, and given we know volatility clustering, momentum and mean reversion of anomalies to be a stylised fact of financial data we can construct a trading premise. Let's first talk more about this premise.
For some markets (cryptocurrency markets - synthetic symbols in TV) the stylised fact of momentum is true, this means that higher momentum is followed by higher momentum, and given we know momentum to be a vector quantity (with magnitude and direction) this momentum can be both positive and negative i.e. when the ID crosses above some threshold we make an assumption it will continue in that direction for some time before executing back to its long run equilibrium of 0 which is a reasonable assumption to make if the market are correlated. For example for the BTCUSD - ETHUSD pair, if the ID > +threshold (inputs for MA and RSI based ID thresholds are found under the ‘‘INTRAMARKET DIFFERENCE INDEX’’ group’), ETHUSD outperforms BTCUSD, we assume the momentum to continue so we go long ETHUSD.
In the standard case we would exit the market when the IDI returns to its long run equilibrium of 0 (for the positive case the ID may return to 0 because ETH’s difference data may have decreased or BTC’s difference data may have increased). However in this strategy we will not define this as our exit condition, why ?
This is because we want to ‘‘let our winners run’’, to achieve this we define a trailing Donchian Channel stop loss (along with a fixed ATR based stop as our volatility proxy). If we were too use the 0 exit the strategy may print a buy signal (ID > +threshold in the simple case, market regimes may be used), return to 0 and then print another buy signal, and this process can loop may times, this high trade frequency means we fail capture the entire market move lowering our profit, furthermore on lower time frames this high trade frequencies mean we pay more transaction costs (due to price slippage, commission and big-ask spread) which means less profit.
By capturing the sum of many momentum moves we are essentially following the trend hence the trend following strategy type.
Here we also print the IDI (with default strategy settings with the MA difference type), we can see that by letting our winners run we may catch many valid momentum moves, that results in a larger final pnl that if we would otherwise exit based on the equilibrium condition(Valid trades are denoted by solid green and red arrows respectively and all other valid trades which occur within the original signal are light green and red small arrows).
another example...
Note: if you would like to plot the IDI separately copy and paste the following code in a new Pine Script indicator template.
indicator("IDI")
// INTRAMARKET INDEX
var string g_idi = "intramarket diffirence index"
ui_index_1 = input.symbol("BINANCE:BTCUSD", title = "Base market", group = g_idi)
// ui_index_2 = input.symbol("BINANCE:ETHUSD", title = "Quote Market", group = g_idi)
type = input.string("MA", title = "Differrencing Series", options = , group = g_idi)
ui_ma_lkb = input.int(24, title = "lookback of ma and volatility scaling constant", group = g_idi)
ui_rsi_lkb = input.int(14, title = "Lookback of RSI", group = g_idi)
ui_atr_lkb = input.int(300, title = "ATR lookback - Normalising value", group = g_idi)
ui_ma_threshold = input.float(5, title = "Threshold of Upward/Downward Trend (MA)", group = g_idi)
ui_rsi_threshold = input.float(20, title = "Threshold of Upward/Downward Trend (RSI)", group = g_idi)
//>>+----------------------------------------------------------------+}
// CUSTOM FUNCTIONS |
//<<+----------------------------------------------------------------+{
// construct UDT (User defined type) containing the IDI (Intramarket Difference Index) source values
// UDT will hold many variables / functions grouped under the UDT
type functions
float Close // close price
float ma // ma of symbol
float rsi // rsi of the asset
float atr // atr of the asset
// the security data
getUDTdata(symbol, malookback, rsilookback, atrlookback) =>
indexHighTF = barstate.isrealtime ? 1 : 0
= request.security(symbol, timeframe = timeframe.period,
expression = [close , // Instentiate UDT variables
ta.sma(close, malookback) ,
ta.rsi(close, rsilookback) ,
ta.atr(atrlookback) ])
data = functions.new(close_, ma_, rsi_, atr_)
data
// Intramerket Difference Index
idi(type, symbol1, malookback, rsilookback, atrlookback, mathreshold, rsithreshold) =>
threshold = float(na)
index1 = getUDTdata(symbol1, malookback, rsilookback, atrlookback)
index2 = getUDTdata(syminfo.tickerid, malookback, rsilookback, atrlookback)
// declare difference variables for both base and quote symbols, conditional on which difference type is selected
var diffindex1 = 0.0, var diffindex2 = 0.0,
// declare Intramarket Difference Index based on series type, note
// if > 0, index 2 outpreforms index 1, buy index 2 (momentum based) until equalibrium
// if < 0, index 2 underpreforms index 1, sell index 1 (momentum based) until equalibrium
// for idi to be valid both series must be stationary and normalised so both series hae he same scale
intramarket_difference = 0.0
if type == "MA"
threshold := mathreshold
diffindex1 := (index1.Close - index1.ma) / math.pow(index1.atr*malookback, 0.5)
diffindex2 := (index2.Close - index2.ma) / math.pow(index2.atr*malookback, 0.5)
intramarket_difference := diffindex2 - diffindex1
else if type == "RSI"
threshold := rsilookback
diffindex1 := index1.rsi
diffindex2 := index2.rsi
intramarket_difference := diffindex2 - diffindex1
//>>+----------------------------------------------------------------+}
// STRATEGY FUNCTIONS CALLS |
//<<+----------------------------------------------------------------+{
// plot the intramarket difference
= idi(type,
ui_index_1,
ui_ma_lkb,
ui_rsi_lkb,
ui_atr_lkb,
ui_ma_threshold,
ui_rsi_threshold)
//>>+----------------------------------------------------------------+}
plot(intramarket_difference, color = color.orange)
hline(type == "MA" ? ui_ma_threshold : ui_rsi_threshold, color = color.green)
hline(type == "MA" ? -ui_ma_threshold : -ui_rsi_threshold, color = color.red)
hline(0)
Note it is possible that after printing a buy the strategy then prints many sell signals before returning to a buy, which again has the same implication (less profit. Potentially because we exit early only for price to continue upwards hence missing the larger "trend"). The image below showcases this cenario and again, by allowing our winner to run we may capture more profit (theoretically).
This should be clear...
🔸 Mean Reversion Case:
We stated prior that mean reversion of anomalies is an standerdies fact of financial data, how can we exploit this ?
We exploit this by normalizing the ID by applying the Ehlers fisher transformation. The transformed data is then assumed to be approximately normally distributed. To form the strategy we employ the same logic as for the z score, if the FT normalized ID > 2.5 (< -2.5) we buy (short). Our exit conditions remain unchanged (fixed ATR stop and trailing Donchian Trailing stop)
🔷 Position Sizing:
If ‘‘Fixed Risk From Initial Balance’’ is toggled true this means we risk a fixed percentage of our initial balance, if false we risk a fixed percentage of our equity (current balance).
Note we also employ a volatility adjusted position sizing formula, the turtle training method which is defined as follows.
Turtle position size = (1/ r * ATR * DV) * C
Where,
r = risk factor coefficient (default is 20)
ATR(j) = risk proxy, over j times steps
DV = Dollar Volatility, where DV = (1/Asset Price) * Capital at Risk
🔷 Risk Management:
Correct money management means we can limit risk and increase reward (theoretically). Here we employ
Max loss and gain per day
Max loss per trade
Max number of consecutive losing trades until trade skip
To read more see the tooltips (info circle).
🔷 Take Profit:
By defualt the script uses a Donchain Channel as a trailing stop and take profit, In addition to this the script defines a fixed ATR stop losses (by defualt, this covers cases where the DC range may be to wide making a fixed ATR stop usefull), ATR take profits however are defined but optional.
ATR SL and TP defined for all trades
🔷 Hurst Regime (Regime Filter):
The Hurst Exponent (H) aims to segment the market into three different states, Trending (H > 0.5), Random Geometric Brownian Motion (H = 0.5) and Mean Reverting / Contrarian (H < 0.5). In my interpretation this can be used as a trend filter that eliminates market noise.
We utilize the trending and mean reverting based states, as extra conditions required for valid trades for both strategy types respectively, in the process increasing our trade entry quality.
🔷 Example model Architecture:
Here is an example of one configuration of this strategy, combining all aspects discussed in this post.
Future Updates
- Automation integration (next update)

CCI and MACD Auto Trading Strategy with Risk/RewardOverview:
This strategy combines the Commodity Channel Index (CCI) and the Moving Average Convergence Divergence (MACD) indicators to automate trading decisions. It dynamically sets stop-loss and take-profit levels based on recent lows and highs, ensuring a risk/reward ratio of 1:1.5. This script aims to leverage trend and momentum signals while maintaining effective risk management.
Originality and Usefulness:
This script is not just a simple mashup of CCI and MACD indicators; it incorporates dynamic risk management by setting stop-loss and take-profit levels based on recent price action. This approach helps traders to:
・Identify potential trend reversals using the combination of CCI and MACD signals.
・Manage trades effectively by setting realistic stop-loss and take-profit levels based on recent market data.
・Maintain a balanced risk/reward ratio, which is essential for sustainable trading.
Indicators Used:
・CCI (Commodity Channel Index):
・Measures the deviation of the price from its average over a specified period, typically ranging from -100 to +100.
・Helps identify overbought and oversold conditions.
・MACD (Moving Average Convergence Divergence):
・Utilizes the difference between short-term and long-term moving averages to indicate trend strength and direction.
・Provides momentum signals that can be used for timing entries and exits.
How It Works:
Entry Conditions:
Long Entry:
・The MACD histogram is above zero.
・The CCI crosses above the -100 line.
Short Entry:
・The MACD histogram is below zero.
・The CCI crosses below the +100 line.
Exit Conditions:
Long Positions:
・The stop-loss is set at the recent low.
・The take-profit is set at 1.5 times the distance between the entry price and the stop-loss.
Short Positions:
・The stop-loss is set at the recent high.
・The take-profit is set at 1.5 times the distance between the entry price and the stop-loss.
Risk Management:
・The script dynamically adjusts stop-loss and take-profit levels based on recent market data, ensuring that the risk/reward ratio is maintained at 1:1.5.
・This approach helps in managing the risk effectively while aiming for consistent profits.
Strategy Properties:
・Account Size: Configured for a realistic account size suitable for the average trader.
・Commission and Slippage: Includes settings for realistic commission and slippage to reflect real market conditions.
・Risk per Trade: Designed to risk no more than 5-10% of equity per trade, aligning with sustainable trading practices.
・Backtesting Results: Configured to generate a sufficient sample size (ideally more than 100 trades) for reliable backtesting results.
Revised Backtesting Settings
Ensure that your backtesting settings are realistic:
・Account Size: Set a realistic initial capital suitable for the average trader.
・Commission and Slippage: Include realistic commission fees and slippage.
・Risk Management: Ensure that each trade risks no more than 5-10% of the account equity.
・Sufficient Sample Size: Choose a dataset that will generate more than 100 trades to provide a robust sample size.

BTC outperform atrategy### Code Description
This Pine Script™ code implements a simple trading strategy based on the relative prices of Bitcoin (BTC) on a weekly and a three-month basis. The script plots the weekly and three-month closing prices of Bitcoin on the chart and generates trading signals based on the comparison of these prices. The code can also be applied to Ethereum (ETH) with similar effectiveness.
### Explanation
1. **Inputs and Variables**:
- The user selects the trading symbol (default is "BINANCE:BTCUSDT").
- `weeklyPrice` retrieves the closing price of the selected symbol on a weekly interval.
- `monthlyPrice` retrieves the closing price of the selected symbol on a three-month interval.
2. **Plotting Data**:
- The weekly price is plotted in blue.
- The three-month price is plotted in red.
3. **Trading Conditions**:
- A long position is suggested if the weekly price is greater than the three-month price.
- A short position is suggested if the three-month price is greater than the weekly price.
4. **Strategy Execution**:
- If the long condition is met, the strategy enters a long position.
- If the short condition is met, the strategy enters a short position.
This script works equally well for Ethereum (ETH) by changing the symbol input to "BINANCE:ETHUSDT" or any other desired Ethereum trading pair.

MCOTs Intuition StrategyInitial Capital: The strategy starts with an initial capital of $50,000.
Execution: Trades are executed on every price tick to capture all potential movements.
Contract Size: The default position size is one contract per trade.
Timeframe: Although not explicitly mentioned, this strategy is intended for a one-minute timeframe.
RSI Calculation: The Relative Strength Index (RSI) is calculated over a user-defined period (default is 14 periods).
Standard Deviation: The script calculates the standard deviation of the change in RSI values to determine the threshold for entering trades.
Exhaustion Detection: Before entering a long or short position, the script checks for exhaustion in the RSI’s momentum. This is to avoid entering trades during extreme conditions where a reversal is likely.
Entry Conditions: A long position is entered when the current RSI momentum exceeds the standard deviation threshold and is less than the previous momentum multiplied by an exhaustion factor. A short position is entered under the opposite conditions.
Limit Orders for Exit: Instead of traditional stop loss and take profit orders, the strategy uses limit orders to exit positions. This means the strategy sets a desired price level to close the position and waits for the market to reach this price.
Profit Target and Stop Loss: The script allows setting a profit target and stop loss in terms of ticks, which are the smallest measurable increments in price movement for the traded asset.
blah blah whatever
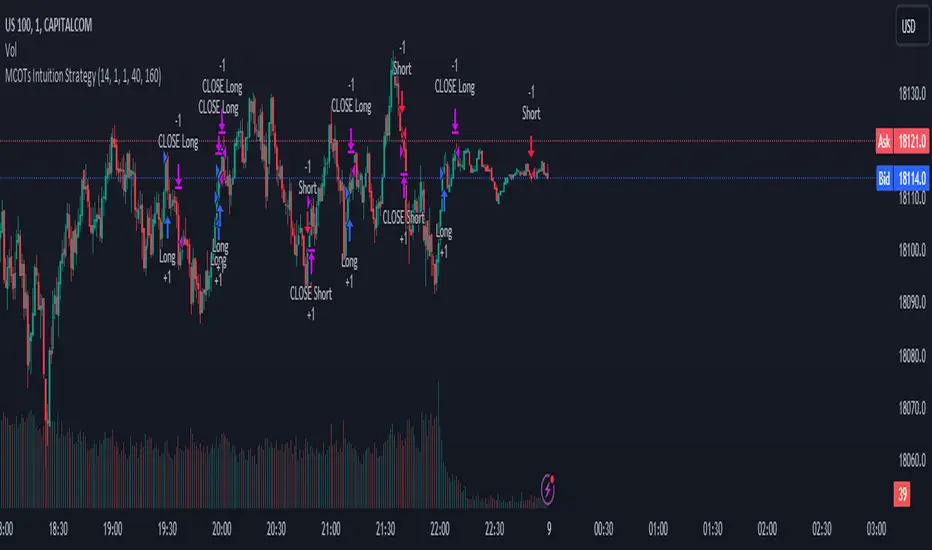
RSI Strategy with Manual TP and SL 19/03/2024This TradingView script implements a simple RSI (Relative Strength Index) strategy with manual take profit (TP) and stop-loss (SL) levels. Let's break down the script and analyze its components:
RSI Calculation: The script calculates the RSI using the specified length parameter. RSI is a momentum oscillator that measures the speed and change of price movements. It ranges from 0 to 100 and typically values above 70 indicate overbought conditions while values below 30 indicate oversold conditions.
Strategy Parameters:
length: Length of the RSI period.
overSold: Threshold for oversold condition.
overBought: Threshold for overbought condition.
trail_profit_pct: Percentage for trailing profit.
Entry Conditions:
For a long position: RSI crosses above 30 and the daily close is above 70% of the highest close in the last 50 bars.
For a short position: RSI crosses below 70 and the daily close is below 130% of the lowest close in the last 50 bars.
Entry Signals:
Long entry is signaled when both conditions for a long position are met.
Short entry is signaled when both conditions for a short position are met.
Manual TP and SL:
Take profit and stop-loss levels are calculated based on the entry price and the specified percentage.
For long positions, the take profit level is set above the entry price and the stop-loss level is set below the entry price.
For short positions, the take profit level is set below the entry price and the stop-loss level is set above the entry price.
Strategy Exits:
Exit conditions are defined for both long and short positions using the calculated take profit and stop-loss levels.
Chart Analysis:
This strategy aims to capitalize on short-term momentum shifts indicated by RSI crossings combined with daily price movements.
It utilizes manual TP and SL levels, providing traders with flexibility in managing their positions.
The strategy may perform well in ranging or oscillating markets where RSI signals are more reliable.
However, it may encounter challenges in trending markets where RSI can remain overbought or oversold for extended periods.
Traders should backtest this strategy thoroughly on historical data and consider optimizing parameters to suit different market conditions.
Risk management is crucial, so traders should carefully adjust TP and SL percentages based on their risk tolerance and market volatility.
Overall, this strategy provides a structured approach to trading based on RSI signals while allowing traders to customize their risk management. However, like any trading strategy, it should be used judiciously and in conjunction with other forms of analysis and risk management techniques.

TTP Intelligent AccumulatorThe intelligent accumulator is a proof of concept strategy. A hybrid between a recurring buy and TA-based entries and exits.
Distribute the amount of equity and add to your position as long as the TA condition is valid.
Use the exit TA condition to define your exit strategy.
Decide between adding only into losing positions to average down or take a riskier approach by allowing to add into a winning position as well.
Take full profit or distribute your exit into multiple take profit exists of the same size.
You can also decide if you allow your exit conditions to close your position in a loss or require a minimum take profit %.
The strategy includes a default built-in TA conditions just for showcasing the idea but the final intent of this script is to delegate the TA entries and exists to external sources.
The internal conditions use RSI length 7 crossing below the BB with std 1 for entries and above for exits.
To control the number of orders use the properties from settings:
- adjust the pyramiding
- adjust the percentage of equity
- make sure that pyramiding * % equity equals 100 to prevent over use of equity (unless using leverage)
The script is designed as an alternative to daily or weekly recurring buys but depending on the accuracy of your TA conditions it might prove profitable also in lower timeframes.
The reason the script is named Intelligent is because recurring buy is most commonly used without any decision making: buy no matter what with certain frequency. This strategy seeks to still perform recurring buys but filtering out some of the potential bad entries that can delay unnecessarily seeing the position in profits. The second reason is also securing an exit strategy from the beginning which no recurring buy option offers out-of-the-box.

Stx Monthly Trades ProfitMonthly profit displays profits in a grid and allows you to know the gain related to the investment during each month.
The profit could be computed in terms of gain/trade_cost or as percentage of equity update.
Settings:
- Profit: Monthly profit percentage or percentage of equity
- Table position
This strategy is intended only as a container for the code and for testing the script of the profit table.
Setting of strategy allows to select the test case for this snippet (percentage grid).
Money management: not relevant as strategy is a test case.
This script stand out as take in account the gain of each trade in relation to the capital invested in each trade. For example consider the following scenario:
Capital of 1000$ and we invest a fixed amount of 1000$ (I know is too risky but is a good example), we gain 10% every month.
After 10 months our capital is of 2000$ and our strategy is perfect as we have the same performance every month.
Instead, evaluating the percentage of equity we have 10% the first month, 9.9% the second (1200$/1100$ - 1) and 5.26% the tenth month. So seems that strategy degrade with times but this is not true.
For this reason, to evaluate my strategy I prefer to see the montly return of investment.
WARNING: The strategy provided with this script is only a test case and allows to see the behavior with different "trades" management, for these reason commision are set to zero.
At the moment only the provided test cases are handled:
test 1 - single entry and single exit;
test 2 - single entry and multiple exits;
test 3 - single entry and switch position;
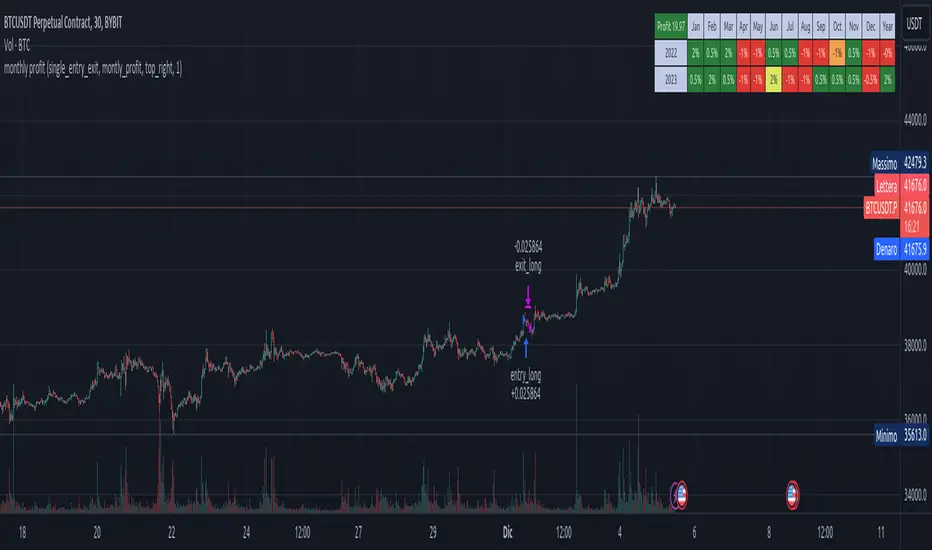
hamster-bot MRS 2 (simplified version) MRS - Mean Reversion Strategy (Countertrend) (Envelope strategy)
This script does not claim to be unique and does not mislead anyone. Even the unattractive backtest result is attached. The source code is open. The idea has been described many times in various sources. But at the same time, their collection in one place provides unique opportunities.
Published by popular demand and for ease of use. so that users can track the development of the script and can offer their ideas in the comments. Otherwise, you have to communicate in several telegram chats.
Representative of the family of counter-trend strategies. The basis of the strategy is Mean reversion . You can also read about the Envelope strategy .
Mean reversion , or reversion to the mean, is a theory used in finance that suggests that asset price volatility and historical returns eventually will revert to the long-run mean or average level of the entire dataset.
The strategy is very simple. Has very few settings. Good for beginners to get acquainted with algorithmic trading. A simple adjustment will help avoid overfitting. There are many variations of this strategy, but for understanding it is better to start with this implementation.
Principle of operation.
1)
A conventional MA is being built. (fuchsia line). A limit order is placed on this line to close the position.
2)
(green line) A limit order is placed on this line to open a long position
3)
(red line) A limit order is placed on this line to open a short position
Attention!
Please note that a limit order is used. Conclude that the strategy has a limited capacity. And the results obtained on low-liquid instruments will be too high in the tester. On real auctions there will be a different result.
Note for testing the strategy in the spot market:
When testing in the spot market, do not include both long and short at the same time. It is recommended to test only the long mode on the spot. Short mode for more advanced users.
Settings:
Available types of moving averages:
SMA
EMA
TEMA - triple exponential moving average
DEMA - Double Exponential Moving Average
ZLEMA - Zero lag exponential moving average
WMA - weighted moving average
Hma - Hull Moving Average
Thma - Triple Exponential Hull Moving Average
Ehma - Exponential Hull Moving Average
H - MA built based on highs for n candles | ta.highest(len)
L - MA built based on lows for n candles | ta.lowest(len)
DMA - Donchian Moving Average
A Kalman filter can be applied to all MA
The peculiarity of the strategy is a large selection of MA and the possibility of shifting lines. You can set up a reverse trending strategy on the Donchian channel for example.
Use Long - enable/disable opening a Long position
Use Short - enable/disable opening a Short position
Lot Long, % - % allocated from the deposit for opening a Long position. In the spot market, do not use % greater than 100%
Lot Short, % - allocated % of the deposit for opening a Short position
Start date - the beginning of the testing period
End date - the end of the testing period (Example: only August 2020 can be tested)
Mul - multiplier. Used to offset lines. Example:
Mul = 0.99 is shift -1%
Mul = 1.01 is shift +1%
Non-strict recommendations:
1) Test the SPOT market on crypto exchanges. (The countertrend strategy has liquidation risk on futures)
2) Symbols altcoin/bitcoin or altcoin/altcoin. Example: ETH/BTC or DOGE/ETH
3) Timeframe is usually 1 hour
If the script passes moderation, I will supplement it by adding separate settings for closing long and short positions according to their MA

MMI Auto Backtesting StrategyDescription:
A strategy based on ATR with auto-backtesting capabilities, Take Profit and Stop Loss (either Normal or Trailing). It allows you to select ranges of values and step for each parameter, and backtest the strategy on a multitude of input combinations at once. You can alternatively use a constant value for each parameter. The backtesting results strive to be as close as possible to those given by Tradingview Strategy Tester.
The strategy displays a table with results for different input combinations. This has columns showing current input combination as well as the following stats: Net Profit, Number of trades, % of Profitable trades, Profit Factor, Max Drawdown, Max Runup, Average Trade and Average number of bars in a trade.
You can sort the table by any column (including sorting by multiple columns at the same time) to find, for example, input combination that gives highest Net Profit (or, if sorting by multiple columns, to find input combination with the best balance of Net Profit and % of Profitable trades). You can filter by any column as well (or multiple columns at the same time), using logical expressions like "< value", "> value", "<= value", ">= value". And you can use logical expressions like "< value%" for Net Profit, Max Drawdown, Max Runup and Average trade to filter by percentage value. You will see a "↓" symbol in column's header if that column is sorted from Highest to Lowest, a "↑" symbol if it's sorted from Lowest to Highest and a "𐕢" symbol if that column is being filtered.
The table has customisable styles (like text color, background color of cells, etc.), and can show the total number of backtested combinations with the time taken to test them. You can also change Initial Capital and Position Size (either Contracts, Currency or % of Equity).
Parameters:
The following parameters are located in the "INPUTS (USUAL STRATEGY)" group, and control the behaviour of strategy itself (not the auto-backtesting functionality):
- Period: ATR Length
- Multiplier: ATR Multiplier
- DPO: length of the filtering moving average
- SL: stop loss
- TP: take profit
- Use Stop Loss: enable stop loss
- Stop Loss Mode: stop loss mode (either Normal or Trailing)
- Use Take Profit: enable take profit
- Wicks: use high & low price, or close price
The strategy also has various parameters separated by different groups:
- INPUTS (AUTO-BACKTESTING): has the same parameters as the "INPUTS (USUAL STRATEGY)" group, but controls the input combinations for auto-backtesting; all the numeric parameters have 3 values: F/V (from), T (to) and S (step); if the checkbox to the left of F/V parameter is off, the value of F/V will indicate the constant value used for that parameter (if the checkbox is on, the values will be from F/V to T using step S)
- STRATEGY: contains strategy related parameters like Initial Capital and Position Size
- BACKTESTING: allows you to display either Percentage, Absolute or Both values in the table and has checkboxes that allow you to exclude certain columns from the table
- SORTING: allows you to select sorting mode (Highest to Lowest or vice versa) and has checkboxes in case you want to sort by multiple columns at the same time
- FILTERING: has a text field for each column of the strategy where you can type logical expressions to filter the values
- TABLE: contains styling parameters
Many parameters have the "(i)" description marker, so hover over it to see more details.
Problems:
- The script works best on lower timeframes and continuous markets (trades 24/7), in other cases the backtesting results may vary from those that Tradingview shows
- The script shows closest results when Take Profit and Stop Loss are not used
- Max Runup percentage value is often wrong
Limitations:
- As we are limited by the maximum time a script can be running (which is 20s for Free plan and 40s for Paid plans), we can only backtest several hundreds of combinations within that timeframe (though it depends on the parameters, market and timeframe of the chart you use)

SOFEX High-End Indicators + BacktestingBINANCE:BTCUSDT.P BINANCE:ETHUSDT.P
Introducing the first publicly available suite of indicators for Bitcoin and Ethereum by Sofex - the High-End Indicators & Backtesting System.
🔬 Trading Philosophy
The High-End Indicators & Backtesting system offers both trend-following and mean-reversal algorithms to provide traders with a deep insight into the highly volatile cryptocurrency markets, known for their market noise and vulnerability to manipulation.
With these factors in mind, our indicators are designed to sidestep most potentially false signals. This is facilitated further by the "middle-ground" time frame (1 Hour) we use. Our focus is on the two largest cryptocurrencies: Bitcoin and Ethereum , which provide high liquidity, necessary for reliable trading.
Therefore, we recommend using our suite on these markets.
The backtesting version of the Sofex High-End Indicators includes mainly trend-following indicators. This is because our trading vision is that volatility in cryptocurrency markets is a tool that should be used carefully, and many times avoided. Furthermore, mean-reversal trading can lead to short-term profits, but we have found it less than ideal for long-term trading.
The script does not aim to make a lot of trades, or to always remain in a position and switch from long to short. Many times there is no direction and the market is in "random walk mode", and chasing trades is futile.
Based on our experience, it is preferable if traders remain neutral the majority of the time and only enter trades that can be exited in the foreseeable future. Trading just for the sake of it ultimately leads to loss in the long-run.
Expectations of performance should be realistic.
We also focus on a balanced take-profit to stop-loss ratio. In the default set-up of the script, that is a 2% : 2% (1:1) ratio. A relatively low stop loss and take profit build onto our idea that positions should be exited promptly. There are many options to edit these values, including enabling trailing take profit and stop loss. Traders can also completely turn off TP and SL levels, and rely on opposing signals to exit and enter new trades.
Extreme scenarios can happen on the cryptocurrency markets, and disabling stop-loss levels completely is not recommended. The position size should be monitored since all of it is at risk with no stop-loss.
We take pride in presenting this comprehensive suite of trading indicators, designed for both manual and automated use. Although automated use leads to increased efficiency, traders are free to incorporate any of our indicators into their own manual trading strategy.
⚙️ Indicators
By default, all indicators are enabled for both Long and Short trades.
Extreme Trend Breakouts
The Extreme Trend Breakouts indicator seeks to follow breakouts of support and resistance levels, while also accounting for the unfortunate fact that false signals can be generated on these levels. The indicator combines trend-breakout strategies with various other volatility and direction measurements. It works best in the beginning of trends.
Underpinning this indicator are renowned Perry Kaufman's Adaptive Moving Averages (PKAMA) alongside our proprietary adaptive moving averages. These dynamic indicators adjust their parameters based on recent price movements, attempting to catch trends while maintaining consistent performance in the long run.
In addition, our modification of the TTM Squeeze indicator further enhances the Extreme Trend Breakouts indicator, making it more responsive, especially during the initial stages of trends and filtering of "flat" markets.
High-Volatility Trend Follower
The High-Volatility Trend Follower indicator is based around the logic of evading market conditions where volatility is low (choppy markets) and aggressively following confirmed trends. The indicator works best during strong trends, however, it has the downside of entering trades at trend tops or bottoms.
This indicator also leverages our proprietary adaptive moving averages to identify and follow high-volatility trends effectively. Furthermore, it uses the Average Directional Index, Aroon Oscillator, ATR and a modified version of VWAP, to categorize trends into weak or strong ones. The VWAP indicator is used to identify the monetary (volume) inflow into a given trend, further helping to avoid short-term manipulations.
Low-Volatility Reversal
The Low-Volatility Reversal aims at plugging the holes that trend-following indicators ignore. It specifically looks for choppy markets. Using proven concepts such as Relative Strength Index and volume measurements, among others, this indicator finds local tops and bottoms with good accuracy. It works best in choppy markets with low to medium volatility. It has a downside that all reversals have, losing trades at the end of choppy markets and in the beginning of big trends.
This indicator, like the others, employs PKAMA in conjunction with our proprietary adaptive moving averages, and an Average PSAR indicator to seek out "sideways" markets. Furthermore, Bollinger Bands with an adaptive basis line is used, with the idea of trading against the short-term trends by looking at big deviations in price movement. The above mentioned indicators attempt to catch local tops and bottoms in markets.
Adaptive Trend Convergence
The Adaptive Trend Convergence aims at following trends while avoiding entering positions at local bottoms and tops. It does so by comparing a number of adaptive moving averages and looking for convergence among them. Adaptive filtering techniques for avoiding choppy markets are also used.
This indicator utilizes our proprietary adaptive moving averages, and an Average Price Range indicator to identify trend convergence and divergence effectively, preventing false signals during volatile market phases. It also makes use of Bollinger Bands with an adaptive moving average basis line and price-action adjusted deviation. Contrasting to the Low-Volatility Reversal condition described above, the Bollinger Bands used here attempt to follow breakouts outside of the lower and upper bands.
Double-Filtered Channel Breakouts
The Double-Filtered Channel Breakouts indicator is made out of adaptive channel-identifying indicators. The indicator then follows trends that significantly diverge from the established channels. This aims at following extreme trends, where rapid, continuous movements in either direction occur. This indicator works best in very strong trends and follows them relentlessly. However, these strong trends can end in strong reversals, and the indicator can be stopped out on the last trade.
Our Double-Filtered Channel Breakouts indicator is built on a foundation of adaptive channel indicators. We've harnessed the power of Keltner Channels and Bollinger Band Channels, with a similar approach used in the Adaptive Trend Convergence indicator. The basis and upper/lower bands of the channels do not rely on fixed deviation parameters, rather on adaptive ones, based on price action and volatility. This combination seeks to identify and follows extreme trends.
Direction Tracker
The Direction Tracker indicator is made out of a central slower, adaptive moving average that clearly recognizes global, long-term trends. Combined with direction and range indicators, among others, this indicator excels at finding the long-term trend and ignoring temporary pullbacks in the opposite direction. It works best at the beginning and middle of long and strong trends. It can fail at the end of trends and on very strong historical resistance lines (where sharp reversals are common).
Our Direction Tracker indicator integrates an adaptive SuperTrend indicator into its core, alongside our proprietary adaptive moving averages, to accurately identify and track long-term trends while mitigating temporary pullbacks. Furthermore, it uses Average True Range, ADX and other volatility indicators to attempt to catch unusual moves on the market early-on.
📟 Parameters Menu
To offer traders flexibility, our system comes with a comprehensive parameter menu:
Preset Selection : Choose between Bitcoin or Ethereum presets to tailor the indicators to your preferred cryptocurrency market.
Global Signal Direction: Set the global signal direction as Long, Short, or Both, depending on your trading strategy.
Global Sensitivity Parameter : Adjust the system's sensitivity to adapt to different trend-following conditions, particularly beneficial during higher-strength trends.
Source of Signals : Toggle individual indicators on or off according to your preference. By default, all indicators are enabled. Customize the indicators to trade Long, Short, or Both, aligning them with your desired market exposure.
Confirmation of Signals : Set the minimum number of confirmed signals on the same bar, ensuring signals are generated only when specific confirmation criteria are met. The default value is one, and it can be adjusted for both Long and Short signals.
Exit of Signals : You have options regarding Take-Profit (TP) and Stop-Loss (SL) levels. Enable TP/SL levels to exit trades at predetermined levels, or disable them to rely on direction changes for exits. Be aware that removing stop losses can introduce additional risk, and position sizing should be carefully monitored.
By enabling Trailing TP/SL, the system switches to a trailing approach, allowing you to:
- Place an initial customizable SL.
- Specify a level (%) for the Trailing SL to become active.
- When the activation level is reached, the system moves the trailing stop by a given Offset (%).
Additionally, you can enable exit at break-even, where the system places an exit order when the trail activation level is reached, accounting for fees and slippage.
Alert Messages : Define the fields for alert messages based on specific conditions. You can set up alerts to receive email, SMS, and in-app notifications. If you use webhooks for alerts, exercise caution, as these alerts can potentially execute trades without human supervision.
Backtesting : Default backtesting parameters are set to provide realistic backtesting performance:
- 0.04% Commission per trade (for both entries and exits)
- 3 ticks Slippage (highly dependent on exchange)
- Initial capital of $1000
- Order size of $1000
While the order size is equal to the initial capital, the script employs a 2% stop-loss order to limit losses and attempts to prevent risky trades from creating big losses. The order size is a set dollar value, so that the backtesting performance is linear, instead of using % of capital which may result in unrealistic backtesting performance.
Risk Disclaimer
Please be aware that backtesting results, while valuable for statistical overview, do not guarantee future performance in any way. Cryptocurrency markets are inherently volatile and risky. Always trade responsibly and do not risk more than you can afford to lose.

Vortex Cross w/MA ConfirmationThis script is a trading strategy that combines the Vortex Indicator and a Moving Average (MA) to generate potential entry signals for long and short positions.
1. Vortex Indicator:
The Vortex Indicator consists of two lines: Vortex Positive (VIP) and Vortex Negative (VIM). It is designed to identify trend direction and measure the strength of a trend.
2. Moving Average (MA):
The script uses a chosen type of Moving Average (SMA, EMA, SMMA, WMA, or VWMA) to smooth the price data. The smoothed line is referred to as the "Smoothing Line."
3. Determine Long and Short Conditions:
The script looks for potential long entry signals when VIP crosses above VIM, highlighting each crossover on the chart, and the closing price is above the Smoothing Line. It searches for short entry signals when VIM crosses above VIP, with the closing price is below the Smoothing Line. When the long or short conditions are met, the strategy enters either a long or short position accordingly.
Potential Usage:
The strategy can be utilized in trending markets, where the Vortex Indicator helps identify trend direction and strength, and the Moving Average smooths the price data to filter out some noise. It aims to capture trends and ride them while avoiding false signals during choppy or sideways markets.
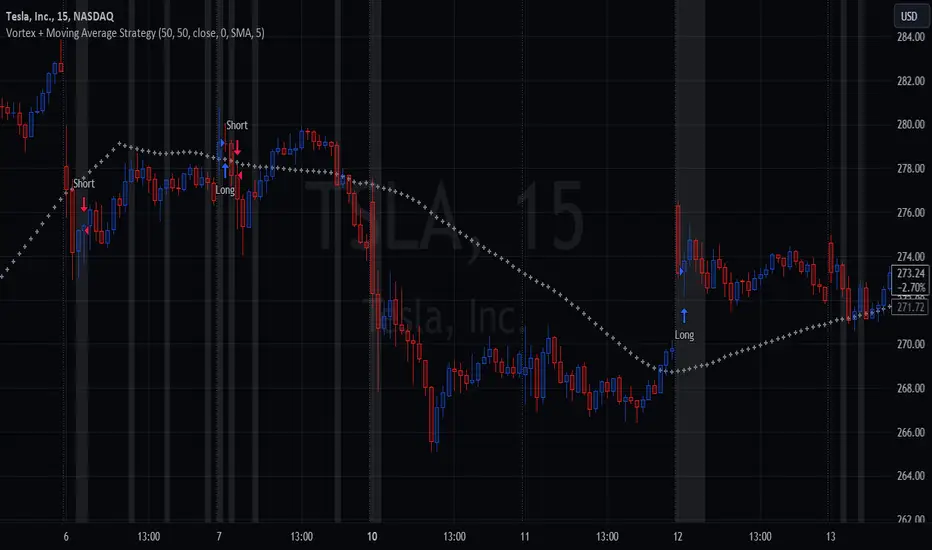
[Camarilla Pivots] Signal Clean Up Analysis with Backtest (TSO)Camarilla Pivots NEW GEN Indicator!
This is a full-cycle trading system indicator, which uses Camarilla Pivots for generating signals using a custom developed algorithm, TP (Take Profit) and SL (Stop Loss) levels. There are 3 SOURCES for signals (each can be used separately or in combination or all 3 can be used at the same time, each signal SOURCE is using Camarilla Pivots levels to open optimal trade direction) with chained (NOTE: There are many potential profitable setups available, by combining clean up features availabe in the indicator settings!) signal cleanup and analysis approach with scheduling and alerting capabilities. Works best with shorter timeframes: 1M, 5M, 15M, 1H.
NOTE: Every calculation is done on a confirmed closed candle bar state, so the indicator will never repaint!
NOTE: At position open - there will be calculated Take-Profit and Stop-Loss targets, however each target is considered hit, when candle bar closes breaking that target, so Take-Profit and Stop-Loss when hit will slightly differ then what you see at position open!
===========================================================================
Explanation of all the Features | Configuration Guide | Indicator Settings | Signal Cleanup Analysis
---------------------------------------------------------------------------
>>> Customizable Backtesting for a specific date range, results via TradingView strategy, which includes “Deep Backtesting” for largest amounts of data on trading results.
>>> Trading Schedule with customizable trading daily time range, automatic closing/alert trades before Power Hour or right before market closes or leave it open until next day.
>>> 3 Trading Systems.
>>> Multiple Signal SOURCEs for opening trades, either SOURCE can be used or both at the same time!
>>> Static/Dynamic Stop-Loss setups (HIGHLIGHT: Stop-Loss will be moved to Entry after TP1 is taken, which minimizes risk).
>>> Single or Multiple profit targets (up to 5).
>>> Take-Profit customizable offset feature (set your Take-Profit targets slightly before everyone is expecting it!).
>>> Candle bar signal analysis (matching candle color, skip opposite structured and/or doji candle uncertain signals).
>>> Additional analysis of VWAP/EMA/ATR/EWO (Elliot Wave Oscillator)/Divergence MACD+RSI/Volume signal confirmation (clean up your chart with indicator showing only the best potential signals!).
>>> Advanced Alerts setup, which can be potentially setup with a trading bot over TradingView Webhook (NOTE: This will require advanced programming knowledge).
===========================================================================
Labels, plots, colors explanations:
---------------------------------------------------------------------------
>>>>> LONG open: green "house" looking arrow below candle bar.
>>>>> SHORT open: red "house" looking arrow above candle bar.
>>>>> LONG/SHORT take-profit target: green/red circles (multi-profit > TP2/3/4/5 smaller circles).
>>>>> LONG/SHORT stop-loss target: green/red + crosses.
>>>>> LONG/SHORT take-profit hits: green/red diamonds.
>>>>> LONG/SHORT stop-loss hits: green/red X-crosses.
>>>>> LONG/SHORT EOD (End of Day | Intraday style) close (profitable trade): green/red squares.
>>>>> LONG/SHORT EOD (End of Day | Intraday style) close (loss trade): green/red PLUS(+)-crosses.
===========================================================================
Date Range and Trading Schedule Settings
---------------------------------------------------------------------------
>>>>> Date Range: Select your start and/or end dates (uncheck “End” for indicator to show results up to the very moment and to use for LIVE trading) for backtesting results, if not using backtesting – uncheck “Start”/“End” to turn it off.
>>>>> Use TradingView “Strategy Tester” to see backtesting results
NOTE: If Strategy Tester does not show any results with Date Ranged fully unchecked, there may be an issue where a script opens a trade, but there is not enough TradingView power to set the Take-Profit and Stop-Loss and somehow an open trade gets stuck and never closes, so there are “no trades present”. In such case you will need to manually check “Start”/“End” dates or use “Depp Backtesting” feature!
>>>>> Trading Schedule: This is where you can setup Intraday Session or any custom session schedule you wish. Turn it ON. Select trading hours. Select EOD (End of Day) setting (NOTE: If it will be OFF, the indicator will assume you are holding your position open until next day!). Please note the EOD trade closure times with the 2 different Intraday close settings when turned on:
At Market Close:
1/3/5min > will close at 15:55pm ET
15min > will close at 15:45pm ET
30min > will close at 15:30pm ET
45min > will close at 15:45pm ET
60min > will close at 15:00pm ET
Before Power Hour:
1/3/5min > will close at 15:00pm ET
15min > will close at 15:00pm ET
30min > will close at 15:00pm ET
45min > will close at 15:00pm ET
60min > will close at 15:00pm ET
>>> Trading Systems: 1) "Open Until Closed by TP or SL": the signal will only open a trade if no trades are currently open/trunning, a trade can only be closed by Take Profit, Stop Loss or End of Day close (if turned on) | 2) "Open Until Closed by TP or SL + OCA": Same as 1), but if there is an opposite signal to the trade which is currently open > it will immediately be closed with new trade open or End of Day close (if turned on) | 3) "OCA (no TP or SL)": There are is Take Profit or Stop Loss, only an opposite signal will close current trade and open an opposite one or End of Day close (if turned on).
>>> Position Open sources:
>>>>> Position Open - SOURCE1 | LONG: S3, SL: S4, TP1: R3, TP2: R4, TP3: R5, TP4/5: Smart Formula | SHORT: R3, SL: R4, TP1: S3, TP2: S4, TP3: S5, TP4/5: Smart Formula
>>>>> Position Open - SOURCE2 | LONG: R4, SL: R3, TP1: R5, TP2/3/4/5: Smart Formula | SHORT: S4, SL: S3, TP1: S5, TP2/3/4/5: Smart Formula
>>>>> Position Open - SOURCE3 | LONG: R5, SL: R4, TP1/2/3/4/5: Smart Formula | SHORT: S5, SL: S4, TP1/2/3/4/5: Smart Formula
>>> Turn On/Off: Current Position SL + Opposite Position Open Signal on the same closing candle bar (If current trade hits Stop-Loss and at that same closing candle bar there is a signal for an opposite direction trade > indicator will close current position as Stop-Loss and immediately open an opposite position). NOTE: With this option turned on, there will be more trades, but not necessarily better results, since after Stop-Loss is hit, it may make sense to wait a little before opening an opposite trade, even if it matches the condition at the same time when Stop-Loss is hit, but sometimes it shows great results, so this setting/feature is included.
>>> Turn On/Off: Turn On/Off: Current Position REGULAR SL | Only the SL + Opposite Position Open will trigger if turned on, IF NOT - THERE WILL BE NO STOP-LOSS AT ALL!!! NOTE: It is very dangerous to trade without Stop-Loss!
>>>>> Signal Candle Bar consuming Take-Profits - position/trade signal candle bar is big enought to "consume"/close ahead the first TP setting > the signal can either be skipped, or all Take-Profit areas pushed ahead using smart formula)
>>>>> MULTIPROFIT | TP (Take-Profit) System: Once the trade is open, all Take-Profit target(s) are immediately calculated and set for the trade > once the target(s) is hit > trade will be partially closed (if candle bar closes beyond several Take-Profit targets > trade will be reduced accordingly to the amount of how many Take-Profit targets were hit)
>>>>> MULTIPROFIT | SL (Stop-Loss) System: 1) Static – Once the trade is open, Stop-Loss is calculated and set for the remaining of the trade ||| 2) Dynamic – At trade open, Stop-Loss is calculated and set the same way, however once 1st Take-Profit is taken > Stop-Loss is moved to Entry, reducing the risk.
>>>>> # of TPs (number of take profit targets): Just like it is named, this is where you select the number of Take-Profit targets for your trading system (NOTE: If "OCA (no TP or SL)" Trading System is selected, this setting won’t do anything, since there are no TP or SLs for that system).
>>>>> TP(s) offset: This is a special feature for all Take-Profit targets, where you can turn on a customizable offset, so that if the price is almost hitting the Take-Profit target, but never actually touches it > you will capture it. This is good to use with HHLL (Highest High Lowest Low), which is pretty much a Support/Resistance as often the price will nearly touch these strong areas and turn around…
===========================================================================
Signal Analysis and Cleanup Settings
---------------------------------------------------------------------------
>>>>> Candle Analysis | Candle Color signal confirmation: If closed candle bar color does not match the signal direction > no trade will be open.
>>>>> Candle Analysis | Skip opposite candle signals: If closed candle bar color will match the signal direction, but candle structure will be opposite (for example: bearish green hammer, long high stick on top of a small green square) > no trade will be open.
>>>>> Candle Analysis | Skip doji candle signals: If closed candle bar will be the uncertain doji > no trade will be open.
>>>>> Divergence/Oscillator Analysis | EWO (Elliot Wave Oscillator) signal confirmation: LONG will only be open if at signal, EWO is green or will be at bullish slope (you can select which setting you desire), SHORT if EWO is red or will be at bearish slope.
>>>>> Divergence/Oscillator Analysis | VWAP signal confirmation: LONG will only be open if at signal, the price will be above VWAP, SHORT if below.
>>>>> Divergence/Oscillator Analysis | Moving Average signal confirmation: LONG will only be open if at signal, the price will be above selected Moving Average, SHORT if below.
>>>>> Divergence/Oscillator Analysis | ATR signal confirmation: LONG will only be open if at signal, the price will be above ATR, SHORT if below.
>>>>> Divergence/Oscillator Analysis | RSI + MACD signal confirmation: LONG will only be open if at signal, RSI + MACD will be bullish, SHORT if RSI + MACD will be bearish.
>>>>> Volume signal confirmation: LONG/SHORT will only be opened with strong Volume matching the signal direction, by default, strong Volume percentage is set to 150% and weak to 50%, but you can change it as you desire.
===========================================================================
||||||||||||||||||||||||||||||||||| *** ||||||||||||||||||||||||||||||||||| *** |||||||||||||||||||||||||||||||||||
||||||||||||||||||||||||||||||||||| *** ||||||||||||||||||||||||||||||||||| *** |||||||||||||||||||||||||||||||||||
TP System - VERY IMPORTANT INFO!
-------------------------------------------------------------------------------------------------------------------
"TP PERCENTAGE" - amount by which current trade/position needs to be reduced/partially closed/sold.
-------------------------------------------------------------------------------------------------------------------
TP System: Dynamic
"TP PERCENTAGE" - will always be the same amount (trade/position size divided by the # of take-profit(TP) targets) and percentage to be closed will always be of the ORIGINAL trade/position.
-------------------------------------------------------------------------------------------------------------------
TP System: Static
"TP PERCENTAGE" - will always be the same amount IF take-profit(TP) targets are hit 1-by-1 (TP1 > TP2 > TP3 > TP4 > TP5), otherwise it will vary and unless it is a 1st take-profit(TP1), the REMAINING trade/position size will always be smaller than original and therefore the percentage to be closed will always be of the REMAINING trade/position and NOT the original one!
-------------------------------------------------------------------------------------------------------------------
"TP PERCENTAGE" CheatSheet (these are the only percentages you may see)
-----------------------------------------------------------------------
TP PERCENTAGE---Close/Sell Amount-------------Example (trade size: 50 stocks)
20%-------------trade size * 0.2--------------50 * 0.2 = 10 stocks
25%-------------trade size * 0.25-------------50 * 0.25 = 12.5(~13) stocks
34%-------------trade size * 0.34-------------50 * 0.34 = 17 stocks
40%-------------trade size * 0.4--------------50 * 0.4 = 20 stocks
50%-------------trade size * 0.5--------------50 * 0.5 = 25 stocks
60%-------------trade size * 0.6--------------50 * 0.6 = 30 stocks
66%-------------trade size * 0.66-------------50 * 0.66 = 33 stocks
75%-------------trade size * 0.75-------------50 * 0.75 = 37.5(~38) stocks
80%-------------trade size * 0.8--------------50 * 0.8 = 40 stocks
100%------------trade size--------------------50 = 50 stocks
-----------------------------------------------------------------------
If for any reason a portion of the current/remaining trade closed at such occurrence was slightly wrong, it is not an issue. Such occurrences are rare and with slight difference in partial TP closed is not significant to overall performance of our algorithms.
||||||||||||||||||||||||||||||||||| *** ||||||||||||||||||||||||||||||||||| *** |||||||||||||||||||||||||||||||||||
||||||||||||||||||||||||||||||||||| *** ||||||||||||||||||||||||||||||||||| *** |||||||||||||||||||||||||||||||||||
Alert Settings (you don’t have to touch this section unless you will be using TradingView alerts through a Webhook to use with trading bot)
---------------------------------------------------------------------------
Here is how a LONG OPEN alert looks like.
NOTE: Each label , , etc. is customizable, you can change the text of it within indicator Input settings.
ALERT >>>>>>>>>>>>>>>>>>>>>>>>>>>>>>>>>>>>>>>>>>>>>>>
COIN: BTCUSD
TIMEFRAME: 15M
LONG: OPEN
ENTRY: 20000
TP1: 20500
TP2: 21000
TP3: 21500
TP4: 22500
TP5: 23500
SL: 19000
Leverage: 0
---------------------------------------------------------------------------
Here is how a TP1 alert will look with 5 TPs breakdown of the trade.
NOTE1: Next to TP1 taken it will show at which price it was triggered.
NOTE2: Next to "TP Percentage" it shows how much of the CURRENT/ACTIVE/REMAINING trade needs to be closed.
NOTE2: If TP2/3/4/5 comes before TP1 - the alert will tell you exactly how many percent of the trade needs to be closed!
ALERT >>>>>>>>>>>>>>>>>>>>>>>>>>>>>>>>>>>>>>>>>>>>>>>
COIN: BTCUSD
TIMEFRAME: 15M
LONG: TP1
TP1: 20500
TP Percentage: 20%
---------------------------------------------------------------------------
Here is how an alert will look for LONG - STOP-LOSS.
ALERT >>>>>>>>>>>>>>>>>>>>>>>>>>>>>>>>>>>>>>>>>>>>>>>
COIN: BTCUSD
TIMEFRAME: 15M
ENTRY: 20000
LONG: SL
SL: 19000
---------------------------------------------------------------------------
Here is how an alert will look for LONG - EOD (End of Day) In Profit close.
ALERT >>>>>>>>>>>>>>>>>>>>>>>>>>>>>>>>>>>>>>>>>>>>>>>
COIN: BTCUSD
TIMEFRAME: 15M
LONG: EOD-Close (profit)
ENTRY: 20000
EOD-Close: 21900
===========================================================================
Adding Alerts in TradngView
---------------------------------------------------------------------------
-Add indicator to chart and make sure it is configured (check back-testing results)
-Right-click anywhere on the TradingView chart
-Click on Add alert
-Condition: Select this indicator by it’s name
-Alert name: Whatever you want
-Hit “Create”
-Note: If you change ANY Settings within the indicator – you must DELETE the current alert and create a new one per steps above, otherwise it will continue triggering alerts per old Settings!
===========================================================================
If you have any questions or issues with the indicator, please message me directly via TradingView.
---------------------------------------------------------------------------
Good Luck! (NOTE: Trading is very risky, past performance is not necessarily indicative of future results, so please trade responsibly!)
---------------------------------------------------------------------------
NOTE: There seems to be a strange glitch when strategy is running live, it will show "double-take" take-profits labels on the chart. This is not affecting the script logic and backtesting results, if you will remove/re-add the script afterwards, it will no longer show the duplicate orders... this must be some sort of a glitch as every alert was thoroughly tested to make sure everything is working!

BTFD strategy [3min]Hello
I would like to introduce a very simple strategy to buy lows and sell with minimal profit
This strategy works very well in the markets when there is no clear trend and in other words, the trend going sideways
this strategy works very well for stable financial markets like spx500, nasdaq100 and dow jones 30
two indicators were used to determine the best time to enter the market:
volume + rsi values
volume is usually the number of stocks or contracts traded over a certain period of time. Thus, it is an important indicator of market activity and liquidity. Each transaction constitutes an individual exchange between the buyer and the seller and constitutes the trading volume of a given instrument or asset.
The RSI measures the strength of uptrends versus downtrends. The signal is the entry or exit of the indicator value of the oversold or overbought level of the market. It is assumed that a value below or equal 30 indicates an oversold level of the market, and an RSI value above or equal 70 indicates an overbought level.
the strategy uses a maximum of 5 market entries after each candle that meets the condition
uses 5 target point levels to close the position:
tp1= 0.4%
tp2= 0.6%
tp3= 0.8%
tp4= 1.0%
tp5= 1.2%
after reaching a given profit value, a piece of the position is cut off gradually, where tp5 closes 100% of the remaining position
each time you enter a position, a stop loss of 5.0% is set, which is quite a high value, however, when buying each, sometimes very active downward price movement, you need a lot of space for market decisions in which direction it wants to go
to determine the level of stop loss and target point I used a piece of code by RafaelZioni , here is the script from which a piece of code was taken
this strategy is used for automation, however, I would recommend brokers that have the lowest commission values when opening and closing positions, because the strategy generates very high commission costs
Enjoy and trade safe ;)
